
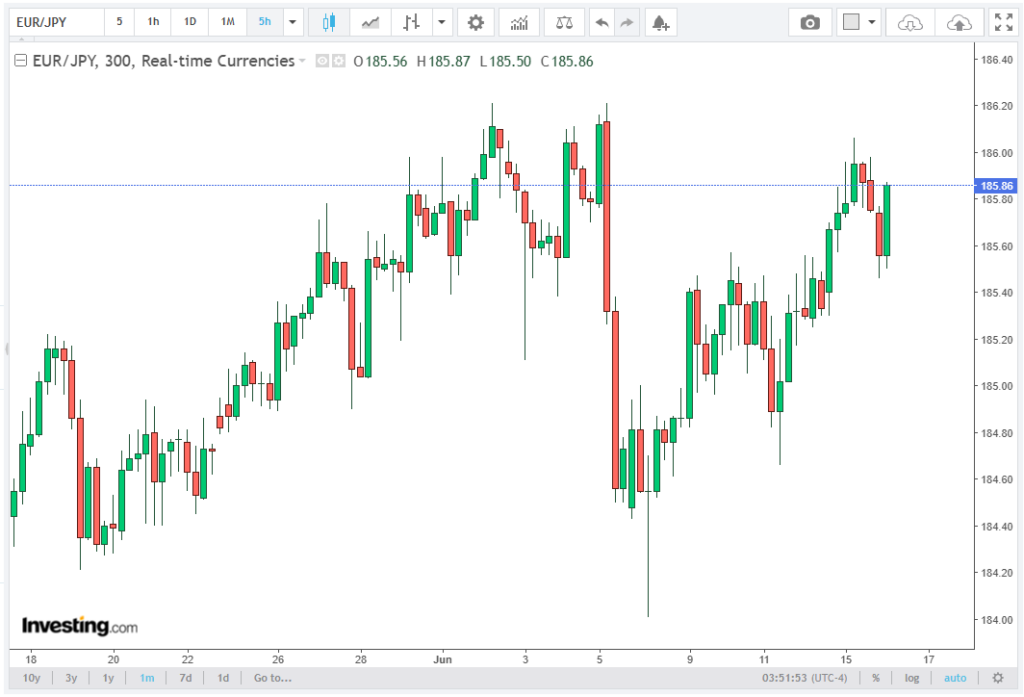
The EUR/JPY currency pair is currently trading around 185.60, reflecting a modest pullback following a two-session advance. This article offers a detailed and easy-to-understand overview of the subject, presented by Marbrisse’s brokers.
Despite the intraday decline, the broader structure remains aligned with a medium-term bullish regime, as price continues to hold above both the nine-day Exponential Moving Average (EMA) at 185.39 and the 50-day EMA at 185.12.
Moving Averages: EMA Compression and Dynamic Support
The interaction between price and key exponential moving averages remains critical. The nine-day EMA at 185.39 is acting as the first dynamic support, with price currently oscillating just above it near 185.50–185.60. This proximity indicates a tight short-term equilibrium zone, where even minor order flow shifts can determine directional bias.
Below this, the 50-day EMA at 185.12 provides secondary structural support. The distance between the nine-day and 50-day EMA is approximately 27–30 pips, reflecting a relatively compressed trend structure, often associated with consolidation rather than expansion.
A sustained breakdown below 185.12 would represent a shift in medium-term momentum, exposing deeper support at the 184.70 channel boundary, which coincides with the lower structural trend line. This confluence makes the 184.70 zone a high-impact technical level in the current setup.
Momentum Conditions: RSI Neutral Bias at 54
The 14-day Relative Strength Index (RSI) is currently positioned near 54, which places it slightly above the neutral 50 threshold. This reading indicates a mild bullish momentum bias, but without overbought pressure or directional acceleration.
Historically, RSI readings between 50 and 60 in trending markets suggest trend continuation potential with limited volatility expansion, especially when aligned with rising moving averages. However, the absence of RSI expansion above 60–65 confirms that bullish momentum remains non-exhaustive and corrective in nature rather than impulsive.
This alignment between RSI and price structure supports the interpretation of a consolidation phase within an established uptrend, rather than a reversal or breakdown scenario.
Resistance Architecture: 186.21 as Primary Barrier
The key structural resistance sits at 186.21 (six-week high), repeatedly acting as a rejection/liquidity ceiling. A valid bullish breakout requires sustained acceptance above this level, ideally daily closes above 186.30–186.50, to confirm continuation momentum. Without confirmation, 186.21 remains a reversal risk zone.
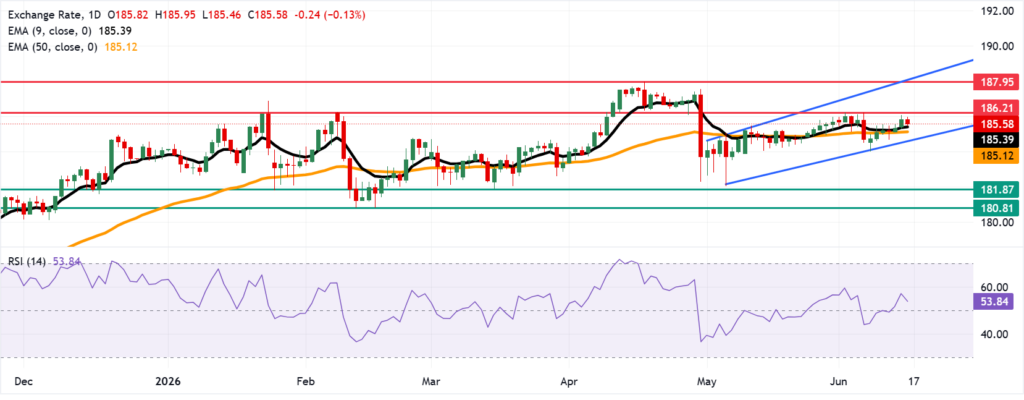
Above, the next major resistance is the April peak at 187.95, the current cycle high. Beyond that, the upper channel boundary near 188.20 marks the projected trend extension target, based on the ascending channel structure. From the current price (185.60), upside extends roughly +235 pips to 187.95 and about +260 pips to 188.20, defining broader bullish expansion potential.
Support Framework: 185.39–185.12 Critical Zone
Immediate support is the 9-day EMA at 185.39, tightly aligned with price, forming a short-term support pivot band (185.40–185.50). Holding above this zone preserves the intraday bullish structure and keeps the probability elevated for another retest of 186.21 resistance.
Below, the 50-day EMA at 185.12 is the key structural support line. A breakdown here signals a shift from bullish consolidation to bearish corrective pressure, increasing downside risk toward 184.70.
The 184.70 level aligns with the lower ascending channel boundary, making it a critical trend invalidation point. A break below it opens deeper downside targets at 181.87 (four-month swing low) and 180.81 (six-month cycle low), representing broader macro retracement zones.
Short-Term Technical Outlook
In the immediate term, the EUR/JPY pair remains in a bullish consolidation phase within a broader ascending channel framework. The key equilibrium zone is defined by 185.12–185.39, where both trend-following and mean-reversion forces converge.
As long as the price remains above this region, the probability of another rotation toward 186.21 resistance remains elevated. A confirmed breakout above this level would open the path toward 187.95 and 188.20, representing higher-timeframe extension targets.
Conversely, a break below 185.12 would shift momentum toward 184.70, with further downside risk extending to 181.87 and 180.81 in a broader corrective scenario.
Conclusion
The EUR/JPY technical structure remains moderately bullish but technically compressed, with price consolidating near 185.60 after a short-term pullback. The integrity of the trend is currently defined by the 185.39–185.12 EMA support cluster, while upside progression remains capped by 186.21 resistance.
Momentum conditions via the RSI at 54 confirm a neutral-to-positive bias, consistent with a continuation setup rather than reversal conditions. The market is therefore positioned in a decision zone, where a break above 186.21 or below 185.12 will determine the next directional leg within the broader ascending channel structure.