
The BTC/USD pair continues to hold above the key $65,000 resistance zone, supported by persistent institutional demand, improving technical momentum, and renewed confidence from Bitcoin ETF inflows.
Bitcoin was trading around $65,100 on Tuesday, extending its recovery from the monthly low of $57,720. This represents a rebound of approximately 12.8%, indicating that buyers have regained control after the recent correction.
The brokers at BCR Limited offer a comprehensive analysis of this topic in the following article.
The current price structure shows Bitcoin consolidating within a narrow range while maintaining a position above important technical levels. The ability to defend the $65,000 breakout area suggests that market participants are absorbing selling pressure and preparing for another potential move higher.
Strategy’s Cash Position Reduces Bitcoin Selling Risk
Market sentiment improved after Strategy maintained its Bitcoin holdings and strengthened its balance sheet. The company recently raised approximately $225 million through equity sales, increasing its cash reserves to around $3.2 billion.
This liquidity position significantly reduces the probability of near-term Bitcoin liquidations. The additional cash reserves provide sufficient resources to cover preferred shareholder dividend obligations for almost two years, allowing the company to avoid selling BTC during periods of market volatility.
Earlier this year, Strategy executed two Bitcoin sales, including an initial sale of 32 BTC and a later transaction involving more than $200 million worth of Bitcoin. However, the recent increase in cash reserves indicates that the company is prioritizing financial flexibility rather than reducing cryptocurrency exposure.
For Bitcoin markets, this is a supportive factor because large-scale corporate selling can create additional supply pressure. The absence of forced selling helps maintain a more balanced BTC supply-demand structure.
Bitcoin ETF Inflows Strengthen Institutional Demand
The latest Bitcoin ETF flow data shows improving institutional participation. US-listed Bitcoin ETFs have recorded more than $500 million in net inflows over five consecutive trading sessions, highlighting renewed demand from professional investors.
If this trend continues, Bitcoin could register its first positive monthly ETF flow performance since April, signaling a potential shift in market sentiment. ETF inflows are important because they create direct buying pressure by requiring fund providers to acquire Bitcoin to support investor exposure.
The increase in ETF demand has occurred alongside higher volatility in traditional financial markets. Concerns surrounding the semiconductor sector, shifting risk sentiment, and geopolitical uncertainty have increased demand for alternative assets.
Energy markets have also experienced significant movement, with Brent crude oil and WTI crude oil prices rising more than 20% from their June lows. Rising commodity volatility and broader market uncertainty have contributed to renewed interest in Bitcoin as a potential portfolio diversification asset.
BTC/USD Technical Analysis: Ascending Channel Signals Further Upside
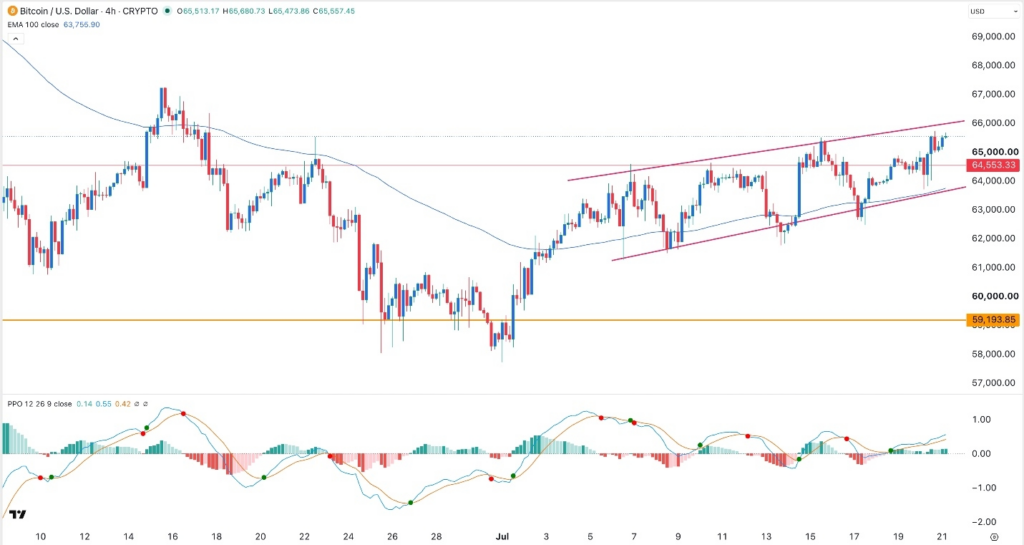
The four-hour BTC/USD chart shows that Bitcoin has developed a clear ascending channel pattern throughout the month. The pair is currently trading near the upper boundary of this channel, suggesting that bullish momentum remains intact but that resistance may increase near higher levels.
Bitcoin has moved above the 50-period moving average, currently positioned around $64,180, confirming short-term strength. Holding above this moving average indicates that buyers are maintaining control and that downside pressure remains limited.
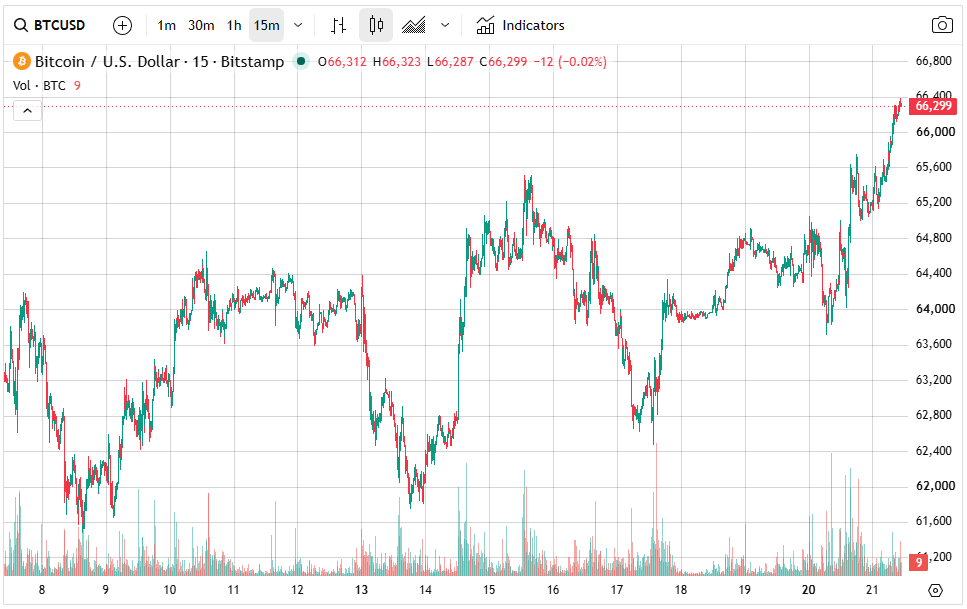
The MACD indicator provides additional confirmation of bullish momentum. The MACD lines have crossed above the zero line, with both lines trending upward. This reflects increasing buying momentum and suggests that the recent recovery has technical support.
The Supertrend indicator has also shifted into a bullish configuration, with BTC/USD trading above the indicator line. This technical setup typically signals that the market trend favors buyers unless price falls back below key support levels.
Bitcoin Price Outlook: $67,375 Resistance Remains the Next Target
The immediate upside target for the BTC/USD pair is the $67,375 resistance level, which represents Bitcoin’s highest price reached in June. A breakout above this level would confirm a stronger bullish continuation pattern and could encourage additional momentum-based buying.
A move above $67,375 would likely shift market focus toward higher resistance zones as traders evaluate whether Bitcoin can establish a new short-term uptrend. However, failure to break this level could result in further consolidation between $64,000 and $67,000.
The bullish scenario remains valid as long as Bitcoin stays above the 50-period moving average at $64,180. A breakdown below this level would weaken the current technical structure and increase the probability of a deeper correction toward lower support areas.
Overall, the BTC/USD outlook remains positive, driven by a combination of strong ETF inflows, reduced institutional selling risk, and improving technical indicators. With Bitcoin holding above the $65,000 support zone, market attention is now focused on whether buyers can push the price toward a decisive breakout above $67,375.