
Bitcoin (BTC/USD) is attempting to recover its short-term bullish structure after a sharp downside correction disrupted its consolidation pattern. Jane Davis, an integral part of F24 Group’s team of experts, provides a comprehensive overview of this subject in this article.
Although the cryptocurrency previously broke out toward multi-month highs, the lack of sustained follow-through buying weakened the breakout signal and increased the risk of a deeper retracement.
However, the latest recovery suggests that bullish momentum remains intact, provided that key support levels hold.
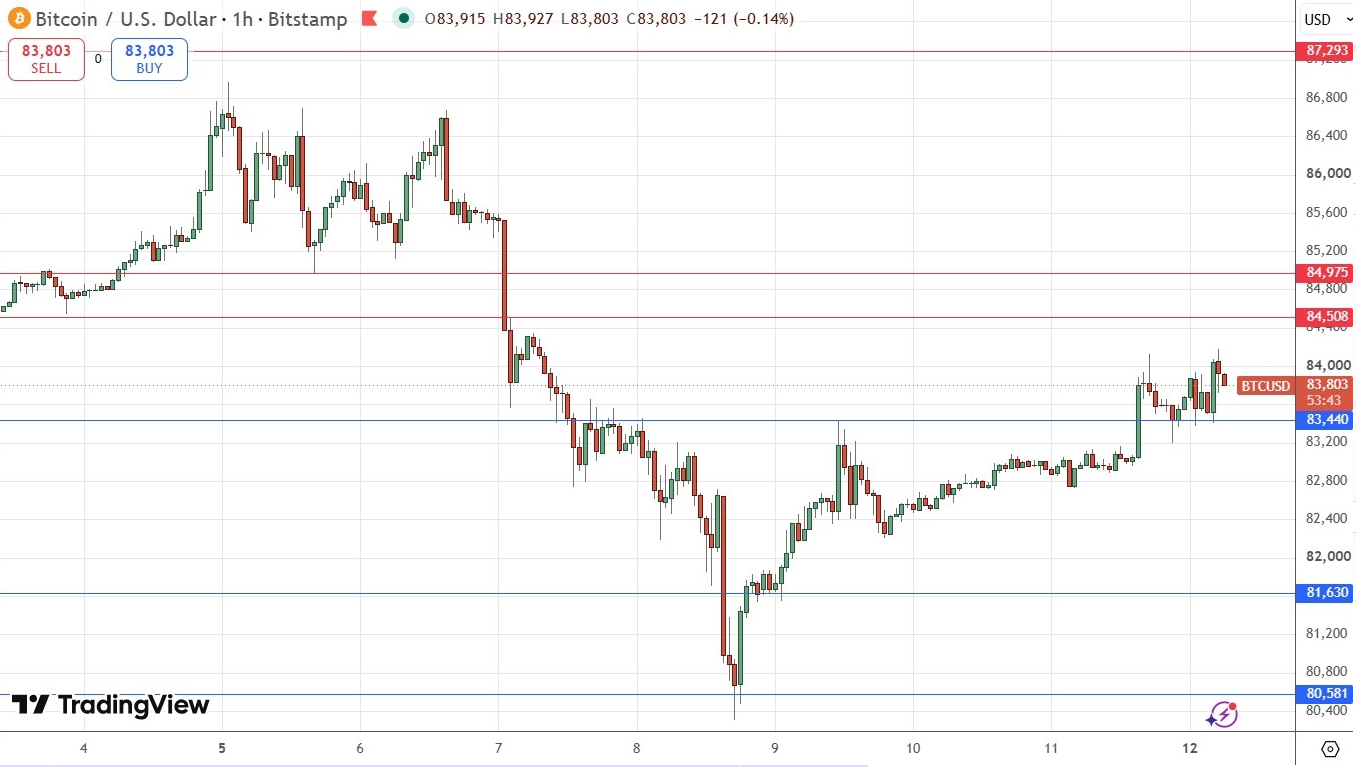
The market remains in a consolidation phase with a cautiously bullish bias. Bitcoin has rebounded from $81,630, recovered the former support at $83,340, and moved above the short-term technical threshold near $83,440. These developments suggest that buyers are regaining control after sellers briefly pushed the price below its previous trading range.
The immediate upside targets are $85,000 and the major resistance at $87,293. A confirmed breakout could revive the broader bullish trend, while renewed selling pressure could trigger another test of lower support.
BTC/USD Technical Analysis: Critical Support Levels
The daily chart identifies $87,293 as the principal resistance limiting Bitcoin’s upside potential. This level represents the upper boundary of the current consolidation and a critical threshold for confirming bullish trend continuation.
The recent decline below $83,340 weakened the short-term price structure and increased the possibility of a retracement toward the $80,000 psychological support level. However, Bitcoin reversed near $81,630, approximately 2.1% above $80,000, before recovering.
The subsequent move above $83,340 represents a reclamation of previously broken support. Such recoveries can indicate a potential bear trap, particularly when sellers lose control and bearish positions are forced to close as prices advance.
Nevertheless, confirmation requires sustained trading above 83,340–83,440. This zone could become a near-term demand area, with a successful retest strengthening the case for a move toward $85,000.
Conversely, a decisive breakdown below this support cluster would weaken the recovery and expose $81,630 to another test. A deeper decline toward $80,000 would significantly undermine the bullish outlook.
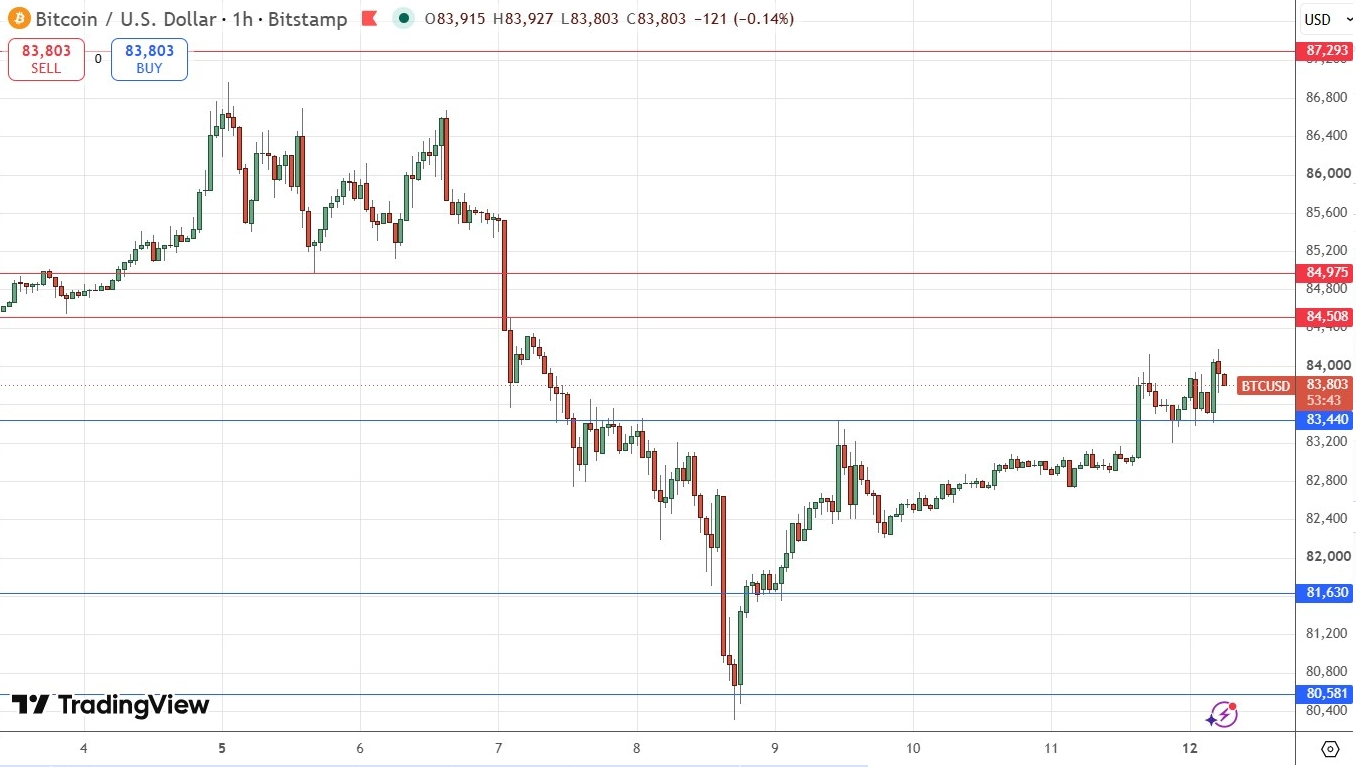
Hourly Chart: $85,000 Is the Key Breakout Level
The hourly BTC/USD chart identifies $83,440 as the immediate technical pivot, separating potential bullish continuation from renewed downside pressure.
Above this threshold, Bitcoin faces closely positioned resistance levels just below $85,000, creating a short-term supply zone where sellers could limit appreciation.
A sustained breakout above $85,000 would improve the market structure, particularly if Bitcoin establishes higher intraday lows and holds above the former resistance. This would suggest that buyers are absorbing selling pressure and that the market is transitioning from consolidation toward trend continuation.
The next major target would be $87,293, approximately 2.7% above $85,000. Moving from $83,440 to $85,000 would require an advance of approximately 1.9%, making this intermediate resistance particularly important for short-term traders.
However, an isolated hourly close above $85,000 does not guarantee a breakout. Traders should monitor price acceptance, subsequent candle closes, and successful resistance-to-support conversion to distinguish a genuine breakout from a false breakout.
Bitcoin Trading Strategy: Risk and Reward
From a trend-following perspective, the rebound supports a cautiously bullish outlook while Bitcoin holds above key support levels. A volatility-adjusted trailing stop can accommodate normal price fluctuations while helping protect against a substantial reversal.
For short-term traders, a daily close below $80,000 would constitute a significant bearish invalidation signal, indicating that buyers had lost a major psychological support threshold. Position exits should reflect individual trading strategies, volatility conditions, and predefined risk limits.
On the upside, a daily close above $87,293 would provide stronger breakout confirmation than an intraday move above $85,000. The signal would be more convincing if accompanied by an expanding daily trading range, a close near the candle’s high, and increased buying participation.
Day traders and swing traders may consider entering after a confirmed breakout above $85,000, provided the entry price remains sufficiently close to resistance to preserve an attractive risk-to-reward ratio.
For example, a hypothetical entry at $85,100 with a protective stop at $84,500 represents approximately 0.71% downside risk, excluding fees and slippage. A move toward $87,293 would offer approximately 2.58% upside, producing a potential reward-to-risk ratio of 3.6:1.
Conclusion: BTC/USD Targets $85,000 and $87,293
Bitcoin’s recovery above $83,340 suggests the recent breakdown may have failed, restoring a cautiously bullish technical outlook. A sustained move above $85,000 could target $87,293, while a confirmed daily close above that level would strengthen broader bullish continuation prospects.
Conversely, breaking below $81,630 and moving toward $80,000 would increase downside risks. Until resistance is decisively cleared, BTC/USD remains in consolidation. Breakout confirmation, support preservation, volatility management, and disciplined risk control remain essential for navigating the next market move safely.