
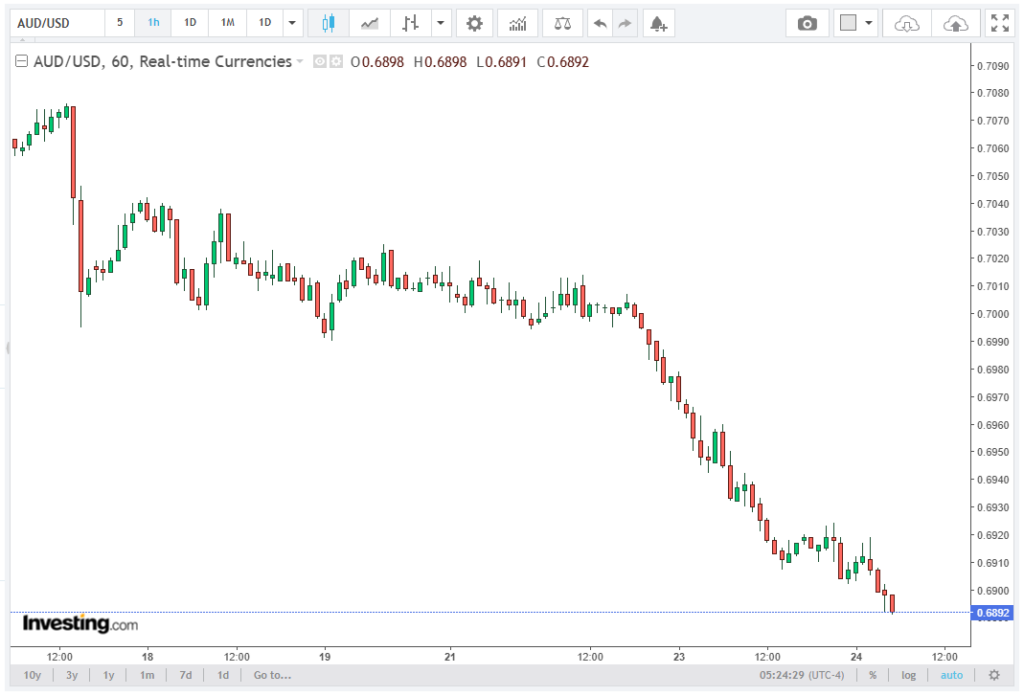
The AUD/USD pair continues to trade with a clearly defined bearish structure, extending losses toward the 0.6900 region, down approximately 0.28% in the latest European session. This marks the weakest level in over 8–10 weeks, confirming a sustained lower-high, lower-low sequence on the short-term chart. In the following article, Vaulltier’s brokers take a closer look at this topic.
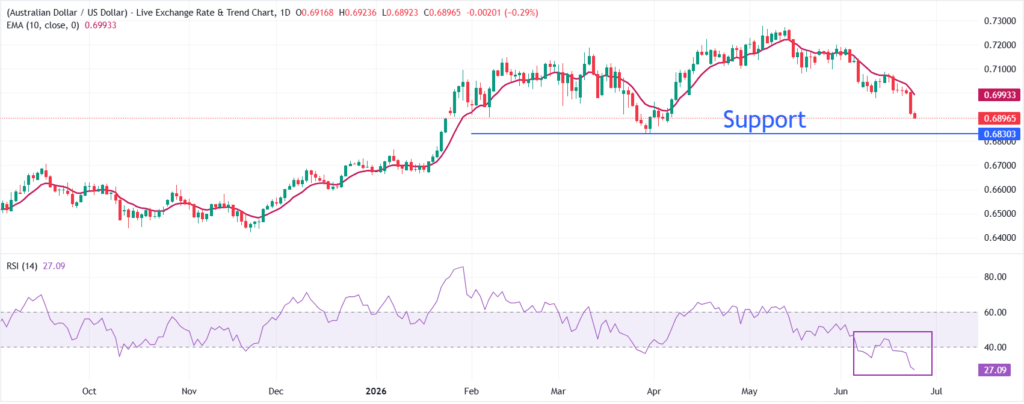
Price action remains firmly capped below the 10-day EMA at 0.6993, reinforcing a persistent short-term downtrend regime. The failure to reclaim this dynamic resistance signals that intraday rebounds are being systematically sold, consistent with a bearish trend continuation model.
The broader macro backdrop continues to favor USD strength, with the US Dollar Index (DXY) advancing to approximately 101.57, up 0.17% on the session. This reinforces a positive correlation between USD momentum and AUD/USD downside pressure.
Monetary Policy Divergence Driving FX Flows
A key structural driver remains the widening divergence in monetary policy expectations between the US and Australia. Current market pricing, derived from the CME FedWatch Tool, assigns an approximately 86% probability of at least one additional Fed rate hike before year-end.
This repricing follows a sustained pattern of US inflation persistence, where both headline CPI and core CPI have exhibited sequential acceleration over recent readings. Core inflation remains structurally elevated above the 3% threshold, sustaining expectations of a higher-for-longer rate environment.
This has direct implications for interest rate differentials, with US yields maintaining a widening spread over Australian equivalents. The resulting capital flow incentive continues to favor USD-denominated assets, reinforcing structural demand for the greenback.
Australian Inflation Dynamics and AUD Weakness
On the domestic side, Australia’s latest inflation data has reinforced a disinflationary trajectory in headline terms. The headline CPI eased to 4.0% YoY, down from 4.2%, and below expectations of 4.4%, representing a negative deviation of approximately 40 basis points versus consensus forecasts.
This deceleration reduces the probability of additional tightening from the domestic central bank, weakening forward rate expectations and compressing AUD yield attractiveness.
However, the core CPI metric rose to 3.6% YoY, compared with 3.4% previously and a consensus of 3.5%. This creates a divergence between headline and underlying inflation, suggesting that while aggregate price pressures are easing, sticky components remain above the 3.5% level.
Despite this mixed signal, markets have interpreted the overall data as net dovish, with reduced expectations for incremental policy tightening. This has resulted in a weaker AUD risk premium, particularly against a strengthening USD backdrop.
Technical Structure: Bearish Continuation Pattern Intact
From a technical standpoint, AUD/USD remains locked in a descending channel formation on the short-term timeframe. The pair continues to trade below both the 10-day EMA at 0.6993 and the 20-day moving average, confirming alignment across short-term trend indicators.
The RSI (14-period) is currently positioned near 27, firmly within oversold territory (<30). While this typically signals exhaustion risk, historical volatility patterns suggest that in strong trending regimes, RSI can remain below 30 for extended periods (5–10 trading sessions) without meaningful reversal.
Momentum indicators such as MACD continue to reflect negative histogram expansion, indicating sustained downside momentum rather than capitulation.
Key Levels and Price Structure
Immediate resistance remains defined at 0.6993, aligned with the 10-day EMA, followed by a secondary resistance zone near 0.7050, which presents prior breakdown support turned resistance.
On the downside, the next critical structural support lies at 0.6833, corresponding to the March 30 swing low. A sustained break below the 0.6900 psychological level would likely trigger stop-loss cascades and accelerate movement toward this region.
Measured move projections from the recent consolidation range suggest an extension target in the 0.6825–0.6835 zone, consistent with prior liquidity clusters and historical demand pockets.
Volatility Conditions and Short-Term Bias
Implied volatility remains moderately elevated, reflecting uncertainty around near-term central bank policy paths. However, realized volatility continues to trend lower than implied, suggesting that market participants are pricing directional risk skew rather than immediate breakout conditions.
Short-term bias remains firmly bearish, with rally attempts likely constrained by layered resistance between 0.6950 and 0.7000. Unless price can achieve a sustained reclaim of the 0.6993 EMA, upside recovery attempts are expected to remain corrective in nature.
Outlook: Structural Downside Continuation Toward 0.6830
The market structure continues to favor further downside, with technical, macro, and yield signals aligned. USD strength is supported by elevated rate expectations, while AUD yield competitiveness is weakening. Price remains below key moving averages, confirming a sustained bearish trend. Overall, these factors point to a likely move toward the 0.6830 support zone.
Unless there is a material shift in US inflation trajectory or a sharp repricing of Fed policy expectations, AUD/USD is likely to maintain its bearish momentum regime, with rallies remaining vulnerable to renewed selling pressure.