
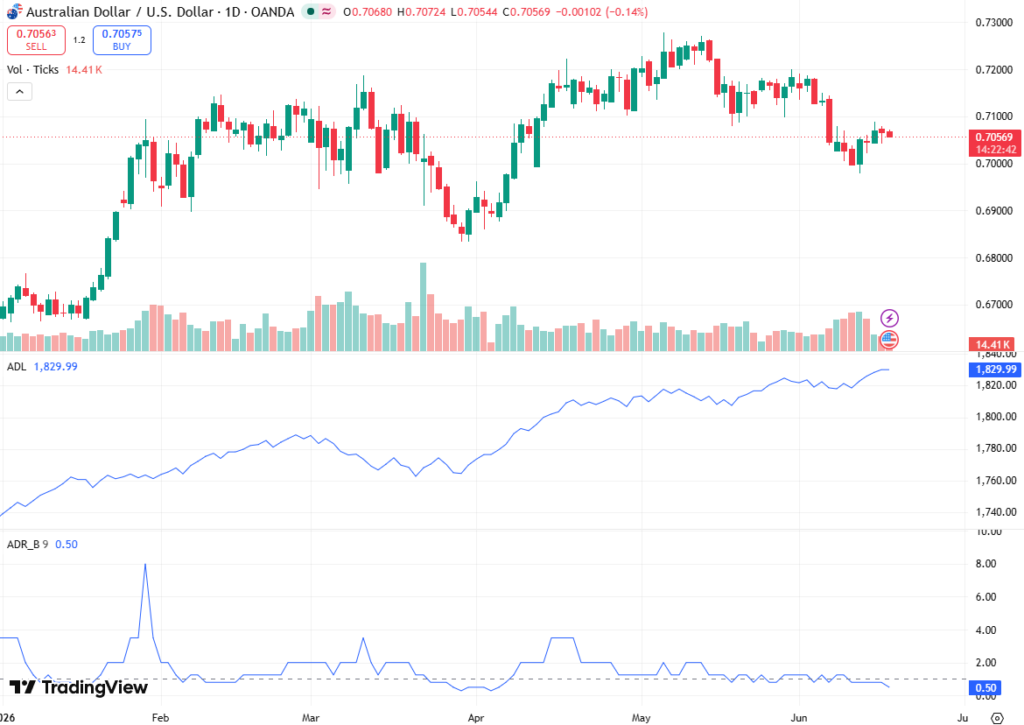
The AUD/USD pair continues to trade with a mild bearish bias for a second consecutive session, yet price action remains confined within a tightening 0.7046–0.7090 range. Spot is currently oscillating just above the 0.7050 handle, reflecting low conviction directional flows ahead of the FOMC policy decision. In this article, Nummixo brokers outline the topic in a detailed and easy-to-understand manner.
Despite the bearish tilt, downside momentum remains non-accelerative, indicating that the market is in a distribution-like consolidation phase rather than a breakdown structure. The inability to sustain movement below 0.7046 (23.6% Fibonacci retracement of the May–June decline) suggests buyers are still defending short-term support zones.
Technical Trend: Bearish Bias Below 100-day SMA Confluence
The broader technical structure remains bearish below the 0.7085–0.7090 resistance band, which represents a critical multi-factor confluence zone combining the 100-day Simple Moving Average (SMA) and the 38.2% Fibonacci retracement of the 0.7209–0.6976 downswing.
Price has repeatedly failed to secure a daily close above this region, reinforcing its role as a dynamic trend ceiling. As long as spot remains below the 100-day SMA (~0.7088), the prevailing bias continues to favor mean reversion lower within the dominant downtrend structure.
The market is effectively trading below all near-term momentum equilibrium thresholds, with price still positioned under the 20-day and 50-day moving averages, reinforcing a bearish alignment across short- to medium-term trend filters.
Momentum Signals: Weak Bearish Continuation Rather Than Breakdown
The RSI at approximately 43.0 remains below the neutral 50 threshold, indicating sub-trend bearish momentum, but not yet in oversold territory (below 30), which typically signals exhaustion. This leaves room for further downside without technical capitulation.
The MACD remains negative, with the MACD line positioned below the signal line and the histogram printing mildly negative values, suggesting persistent downside pressure but declining momentum velocity. This divergence between price stability and weak momentum expansion supports the current range-bound bearish consolidation structure rather than a trending breakdown.
Resistance Architecture: 0.7090 as Immediate Structural Barrier
Immediate resistance is firmly defined at the 0.7085–0.7090 cluster, which represents the most important technical ceiling in the short-term structure. This zone coincides with the 100-day SMA and the 38.2% Fibonacci retracement at 0.7086, creating a high-probability supply concentration area.
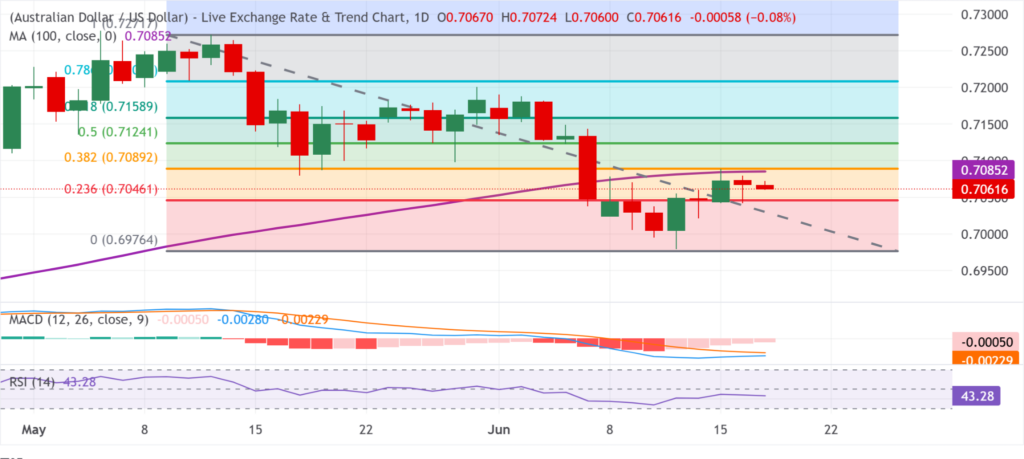
A sustained breakout above 0.7090 would be required to neutralize the current bearish pressure. Above this level, the next resistance is located at 0.7124 (50% retracement of 0.7209–0.6976), followed by 0.7159 (61.8% Fibonacci retracement), which represents a key bearish control boundary.
Further upside extension toward 0.7209 (78.6% retracement) would signal a deeper corrective phase, while a move toward 0.7272 (recent swing high) would imply a full structural reversal of the current downtrend sequence. However, such expansion would require a clear shift in US rate expectations and global yield differentials, which is not currently priced in.
Support Structure: 0.7046–0.6976 as Critical Downside Zone
On the downside, initial structural support remains at 0.7046, aligned with the 23.6% Fibonacci retracement level. This level has repeatedly acted as a short-term liquidity absorption zone, preventing accelerated downside continuation.
A decisive break below 0.7046 would expose the next major support at 0.6976, which marks the monthly low and a key structural pivot in the broader downtrend channel. This level represents the lower boundary of the current corrective consolidation and is critical for maintaining medium-term bullish retracement potential.
A breakdown below 0.6976 would confirm a renewed bearish expansion phase, potentially opening the path toward lower Fibonacci extensions beyond the current retracement framework.
Event Risk: FOMC as Volatility Catalyst
The upcoming FOMC decision remains the primary catalyst for directional resolution. Market pricing currently reflects a wait-and-see equilibrium, with reduced leverage exposure and suppressed volatility across G10 FX pairs.
A more restrictive policy tone would likely reinforce USD strength via yield differential widening, pushing AUD/USD toward 0.7046 and potentially 0.6976. Conversely, a softer tone would increase the probability of a short squeeze toward the 0.7085–0.7124 resistance band.
Conclusion: Bearish Structure Intact but Range Dominates
AUD/USD remains in a technically bearish but structurally compressed regime, trading above 0.7050 while capped by the 0.7085–0.7090 100-day SMA confluence zone.
The interaction between macro neutrality, weak momentum signals, and strong technical compression suggests continued range-bound behavior between 0.7046 and 0.7090 in the immediate term.
A break above 0.7090 would neutralize bearish pressure and shift focus toward 0.7124–0.7159, while a breakdown below 0.7046 would reassert downside control toward 0.6976 and potentially extend the broader bearish trend structure. Until then, AUD/USD remains in a pre-breakout consolidation phase awaiting FOMC-driven volatility expansion.