
Solana (SOL) is showing signs of technical weakness as bearish momentum intensifies across the cryptocurrency market, with the token struggling to maintain its position above the critical $100 psychological support level.
Aurelgate’s industry perspective helps shape this article, offering a detailed look at the topic and its key considerations.
SOL has declined by approximately 1.3% over the past 24 hours, returning to a key demand zone as traders position themselves ahead of the Federal Reserve’s monetary policy decision.
Despite the decline, 24-hour trading volume has increased by approximately 40%, indicating heightened market participation around the $100 threshold. This expansion suggests that buyers are attempting to defend the current price level, although increased activity alone does not confirm accumulation or a bullish reversal.
From a technical perspective, $100 represents an important psychological support zone, while the next downside target sits around $96. A successful defense could establish a short-term consolidation structure. A breakdown under elevated selling volume would increase the probability of an extended correction.
Macroeconomic uncertainty is adding further volatility. Market expectations indicate only a 9% probability of an interest rate increase during the upcoming Federal Open Market Committee (FOMC) meeting. Investors are therefore focusing on the central bank’s forward guidance and potential signals regarding future monetary tightening.
Solana On-Chain Metrics Signal Weakening Network Demand
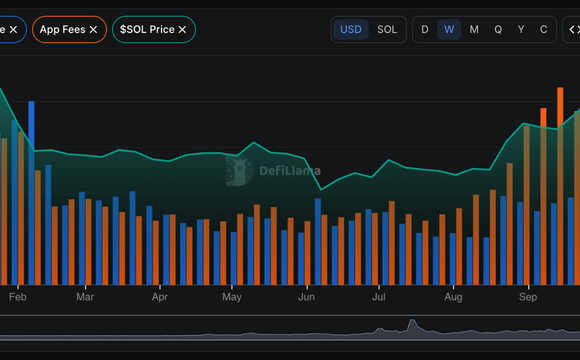
The most concerning development for Solana is the deterioration of its on-chain fundamentals. Network activity indicators suggest that ecosystem usage has contracted for four consecutive weeks, raising questions about demand despite recent infrastructure improvements.
Weekly application fees have declined from approximately $115 million to $72 million, representing a 37.4% contraction. This reduction indicates weaker economic activity across decentralized applications and potentially lower monetization of network usage.
Meanwhile, weekly decentralized exchange (DEX) trading volume has dropped from approximately $19 billion to $12.3 billion, representing a decline of roughly 35.3%. This highlights a significant reduction in trading activity and liquidity across Solana-based decentralized finance platforms.
These indicators are important because application fees and DEX volumes provide measurable information about ecosystem participation. Persistent contractions can indicate reduced user engagement, declining speculative demand, and weaker transaction-driven revenue.
Institutional capital flows are also deteriorating. According to SoSoValue, Solana-related exchange-traded funds (ETFs) recorded approximately $80 million in net outflows, reversing a previously positive inflow figure of $271 million.
Alpenglow Upgrade Provides a Long-Term Bullish Catalyst
Despite weakening on-chain data, Solana’s technological development remains an important component of its longer-term investment thesis.
The recently implemented Alpenglow upgrade significantly improved transaction settlement performance, reducing finality times from approximately 12.8 seconds to 150 milliseconds or less.
This represents a reduction in settlement latency of approximately 98.8%, potentially improving the network’s suitability for high-frequency decentralized applications, payment infrastructure, and latency-sensitive financial operations.
The upgrade strengthens Solana’s technical competitiveness and could support future ecosystem expansion. Its impact on token valuation will depend on whether improved network performance translates into higher transaction demand, greater application revenue, and sustained growth in active users.
SOL Price Prediction: 200-Day EMA Determines Whether $77 Is Next
From a technical analysis perspective, the daily SOL chart highlights two critical support areas: the $96 horizontal support zone and the 200-day exponential moving average (EMA).
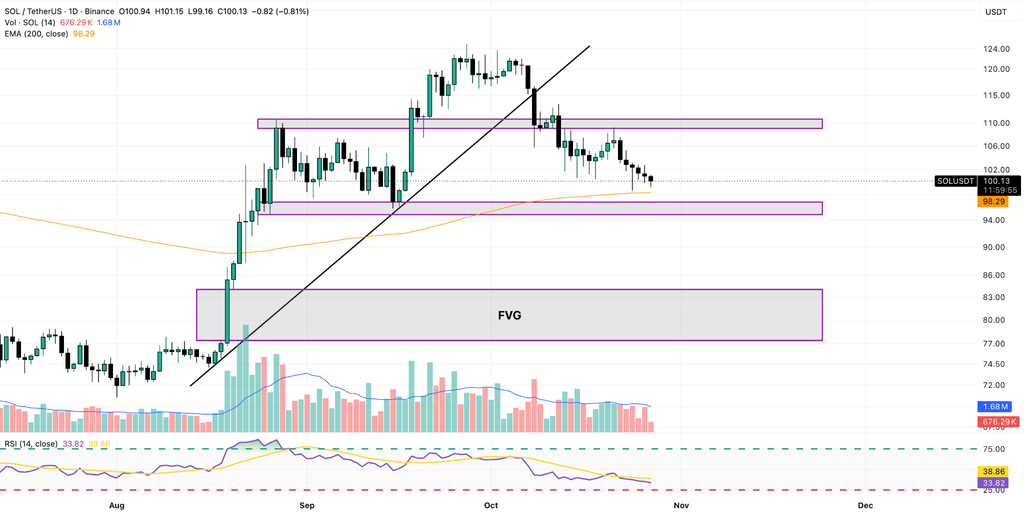
These levels represent important technical reference points for determining whether the current correction remains controlled or develops into a broader bearish continuation pattern.
The Relative Strength Index (RSI) currently stands at approximately 33, indicating substantial negative momentum and positioning SOL close to the conventional oversold threshold of 30.
An RSI reading near 30 increases the probability of a technical rebound, particularly if selling volume declines near established support. A recovery from the $96 region could initially expose the 105-110 resistance zone, with $110 representing the next major upside target.
A sustained recovery would require improving momentum, stronger buying volume, and stabilization in on-chain activity.
The bearish scenario becomes more significant if SOL records a daily close below $96 and loses the 200-day EMA. Such a breakdown could invalidate the immediate recovery setup and expose lower liquidity areas.
Under this scenario, the next downside targets would emerge around $84, followed by the $77 region. The latter represents a potential correction zone associated with an earlier price imbalance created during the late-August rally.
Conclusion: SOL Remains Vulnerable to a Deeper Correction
Solana’s short-term outlook remains bearish despite its ability to defend the $100 threshold. Application fees have contracted by 37.4%, weekly DEX volumes have declined by approximately 35.3%, and ETF flows have shifted into negative territory.
Although the Alpenglow upgrade significantly improves network performance, current on-chain metrics do not yet confirm renewed ecosystem demand.
Technically, $96 and the 200-day EMA are the decisive support levels. Holding these areas could facilitate a recovery toward $110, while a confirmed breakdown could expose $84 and $77 as subsequent downside targets. Until network activity, institutional flows, and momentum indicators improve, SOL remains exposed to additional selling pressure.