
Ethereum (ETH) is approaching a critical technical inflection point after recently testing its 200-day exponential moving average (EMA). This long-term trend indicator represents a major support zone, and its ability to withstand selling pressure could determine whether ETH resumes its recovery or enters another corrective phase.
Drawing on Aurelgate’s practical experience, this piece offers a closer examination of the subject.
The recent bounce from the 200-day EMA indicates underlying buying interest, but the recovery remains fragile. Trading volume was below average, suggesting insufficient bullish participation to confirm a sustained reversal.
The upcoming Federal Open Market Committee (FOMC) interest rate decision adds uncertainty. Markets generally expect unchanged interest rates, despite inflation exceeding forecasts. Policymakers may prefer a wait-and-see approach to assess the effects of previous monetary tightening.
Elevated geopolitical tensions in the Middle East and oil prices above $100 could complicate the inflation outlook. An unexpected rate increase would represent a monetary policy shock, potentially triggering a broad risk-off reaction across financial markets.
Given Ethereum’s sensitivity to liquidity conditions, such an outcome could accelerate capital outflows from digital assets.
The combination of macroeconomic uncertainty, declining momentum, and the 200-day EMA test makes the current price structure particularly important.
ETH Price Prediction: Why $1,970 Is the Critical Downside Target
Ethereum’s historical price action provides a potential roadmap for its next major move. The Pectra upgrade in May 2025 preceded a substantial recovery that helped ETH transition from bearish consolidation into a stronger bullish structure.
The weekly timeframe reveals similarities between that recovery and the current market configuration. During the previous advance, ETH broke above the $2,000 psychological threshold, generating strong bullish momentum and creating a Fair Value Gap (FVG).
A similar structure could develop again, with $1,970 emerging as the primary downside target. A correction toward this region would allow ETH to revisit an important structural support area and potentially establish a stronger demand base.
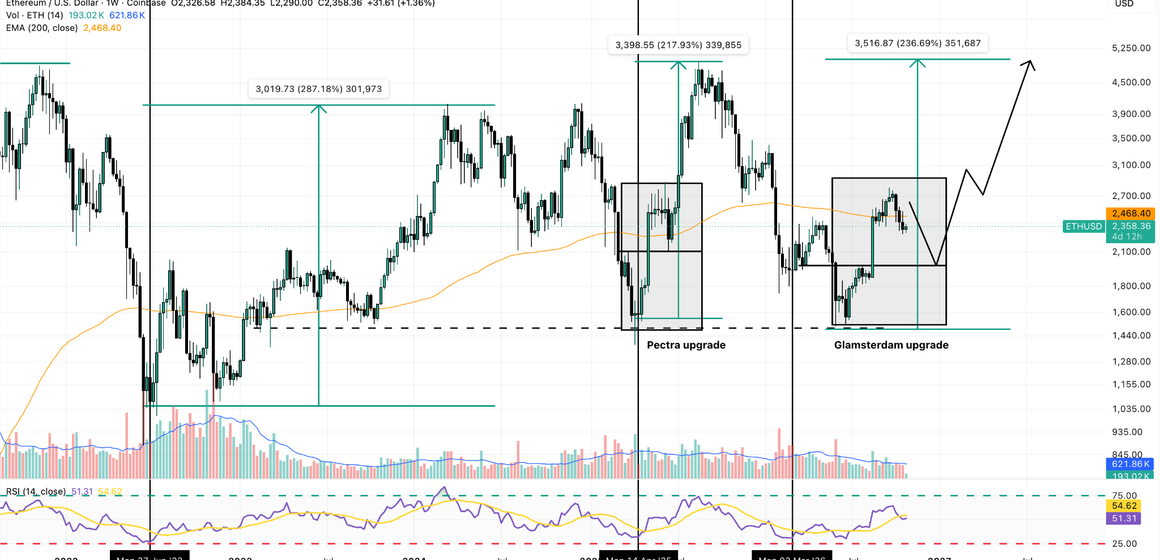
A decline toward $1,970 would not automatically invalidate the bullish outlook. Instead, a controlled retracement followed by a confirmed bullish reversal could establish a stronger foundation for another impulsive advance.
On the upside, $2,800 represents the key resistance level. A decisive weekly breakout above this threshold, supported by increasing trading volume, would strengthen the probability of trend continuation. Under this scenario, Ethereum could advance toward the $4,000 resistance zone.
200-Day EMA Breakdown Could Accelerate Selling Pressure
On the daily timeframe, Ethereum’s interaction with the 200-day EMA deserves particular attention. This indicator helps distinguish bullish and bearish market regimes, with sustained trading above it generally supporting a positive long-term structure.
A daily candle close below the 200-day EMA, particularly alongside expanding bearish volume, would provide an important confirmation signal. Such a breakdown could trigger additional stop-loss orders, liquidations, and systematic selling from trend-following traders.
Increasing selling pressure could push ETH toward intermediate liquidity zones before testing the $1,970 structural support.
Traders should monitor price action, the 200-day EMA and trading volume. A temporary intraday breach is less significant than multiple daily closes below the indicator accompanied by increasing downside participation.
RSI Below 40 Signals Accelerating Bearish Momentum
Ethereum’s Relative Strength Index (RSI) has dropped below 40, indicating strengthening selling pressure.
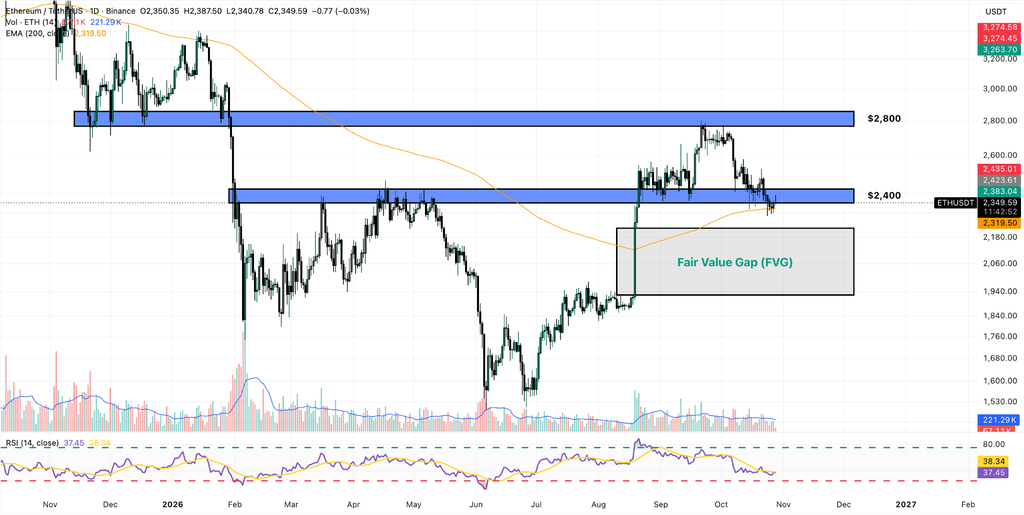
The RSI measures the speed and magnitude of recent price movements on a scale from 0 to 100. Readings below 50 generally indicate negative momentum, while values approaching or falling below 30 traditionally signal oversold conditions.
With ETH’s daily RSI below 40, bearish momentum is increasingly dominant. The indicator has not necessarily reached the oversold threshold required to support a stronger mean-reversion move.
A decline toward RSI 30, combined with ETH testing the $1,970 demand zone, could create favorable conditions for bullish RSI divergence or another momentum reversal signal, strengthening the probability of a technical relief rally.
FOMC Volatility Could Trigger Ethereum’s Next Major Move
The FOMC announcement could accelerate the correction as options expirations, leveraged positioning and trading-volume fluctuations contribute to short-term volatility.
An unexpected hawkish decision could increase selling pressure and strengthen the probability of a breakdown below the 200-day EMA. A less restrictive policy outcome could help ETH stabilize and attempt another recovery.
The $1,970 support, 200-day EMA and $2,800 resistance remain the most important technical reference levels.
Conclusion
Ethereum’s technical outlook remains vulnerable to another corrective move, with $1,970 representing a critical downside target before a potential continuation of its broader rally. The weakening daily RSI below 40, relatively low rebound volume and ongoing test of the 200-day EMA suggest that bearish momentum has not fully exhausted itself.
A confirmed breakdown below the moving average would strengthen the bearish scenario, while a recovery above $2,800 could establish the conditions for an advance toward $4,000.
Traders should monitor volume expansion, RSI stabilization and reactions around major liquidity zones before treating the current rebound as confirmation of a renewed bullish trend.