
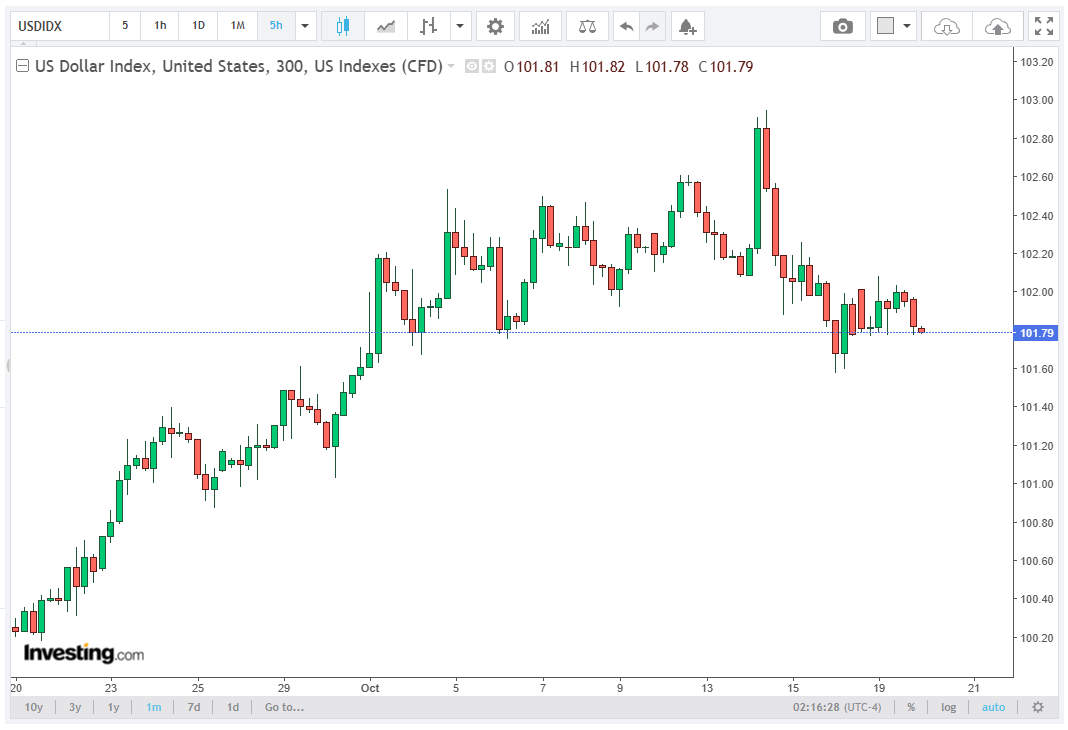
The US Dollar Index (DXY) declined to approximately 101.80 during Tuesday’s early European session, slipping below the psychologically significant 102.00 threshold as market participants reassessed the Federal Reserve’s (Fed) interest-rate trajectory.
The move reflects adjustments in short-term rate expectations, uncertainty surrounding monetary-policy guidance, and positioning ahead of the next Federal Open Market Committee (FOMC) meeting.
In this article, Risance’s brokers explore the topic in depth.
The DXY measures the US Dollar’s relative value against six major currencies, with the euro carrying the largest weighting at approximately 57.6%, followed by the Japanese yen at 13.6% and the British pound at 11.9%.
The index’s decline indicates a weakening of the Dollar against its weighted currency basket, although the magnitude of the move must be evaluated alongside Treasury yields and broader foreign-exchange positioning.
Market attention is turning toward ADP employment data, Housing Starts, and Building Permits, which could influence expectations for economic growth and the Fed’s policy stance.
Changes in employment conditions and housing activity may affect assessments of aggregate demand, inflation persistence, and the appropriate degree of monetary restriction.
Inflation Persistence Complicates the Fed’s Rate Outlook
Recent US inflation readings continue to complicate the monetary-policy outlook. Wholesale prices reportedly increased 6.3% year over year, marking their strongest advance since 2022, while headline Consumer Price Index (CPI) inflation reached 3.7% annually, exceeding market expectations.
Persistent price pressures increase the probability that the Fed will maintain a restrictive policy stance for an extended period. Elevated inflation can support the Dollar through higher expected policy rates and stronger US Treasury yields, particularly when American interest-rate returns outperform those available in other developed economies.
The relationship between inflation and the DXY depends on the difference between actual economic data and market expectations. If inflation exceeds forecasts, investors may increase expectations for prolonged monetary restriction, supporting the Dollar.
If labor-market indicators weaken sufficiently to offset inflation concerns, expectations for future rate cuts could strengthen.
Markets Price an 82.8% Probability of a Rate Hold
According to the CME FedWatch Tool, interest-rate futures indicate an 82.8% probability that the FOMC will leave borrowing costs unchanged at its upcoming meeting. This pricing suggests that a policy hold is the dominant market expectation.
A rate hold would preserve the existing degree of monetary restriction while allowing policymakers to evaluate incoming data. The outcome itself may generate a limited market reaction if it is already fully reflected in prices.
Greater volatility could emerge from changes to the policy statement, updated economic projections, or guidance concerning future rate decisions.
Scotiabank analysts have identified reduced expectations for near-term Fed tightening as a potential source of Dollar weakness. Lower expected US yields can narrow interest-rate differentials, reducing the relative attractiveness of Dollar-denominated assets.
Meanwhile, stronger-than-expected Chinese third-quarter GDP growth of 4.5% year over year has supported the Australian and New Zealand Dollars. These currencies may benefit from improved expectations for Chinese demand and regional trade.
Divergent performance among major currencies can amplify movements in the DXY because of the index’s concentrated euro weighting.
Technical Analysis: Resistance at 101.85 and 102.75
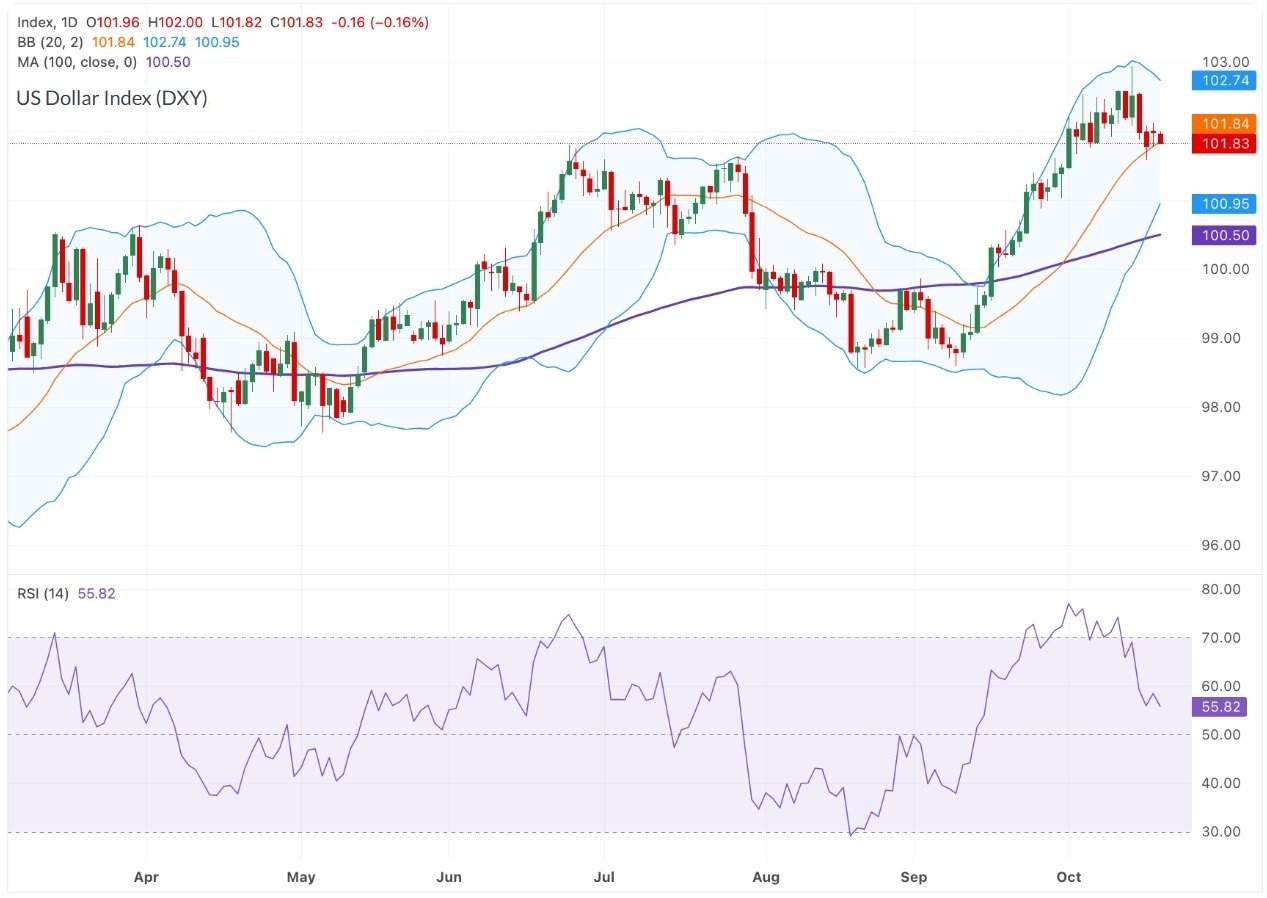
The daily technical structure remains cautiously bullish, with the DXY trading above its 100-day simple moving average (SMA) near 100.50. The index’s position above this longer-term trend indicator suggests that the broader recovery remains intact despite the latest decline.
The Relative Strength Index (RSI) at 55.8 indicates moderate positive momentum. The reading remains above the neutral 50 level but below conventional overbought territory near 70, suggesting that upside momentum is positive without being excessively extended.
Immediate resistance stands near 101.85, around the identified Bollinger middle band. A sustained breakout above this level could expose 102.00 and then 102.75, where the upper Bollinger Band represents a stronger technical barrier.
On the downside, initial support is located at 100.95, followed by the 100-day SMA near 100.50. A break below 100.95 would increase downside risk, while a sustained move beneath 100.50 would weaken the broader bullish structure. These levels remain conditional on price confirmation and changing market volatility.
Conclusion
The DXY’s decline to 101.80 reflects adjustments in Federal Reserve expectations, despite inflation remaining elevated at 3.7% for headline CPI and wholesale prices reportedly rising 6.3% annually.
With an 82.8% probability of a rate hold, the market is focused on incoming economic data and the implications for Treasury yields and interest-rate differentials. Technically, resistance at 101.85 and 102.75 defines the immediate recovery barriers, while support at 100.95 and 100.50 provides the principal downside reference zone.
The next directional move will depend on whether economic data strengthens expectations for prolonged monetary restriction or accelerates the repricing of future Fed easing.