
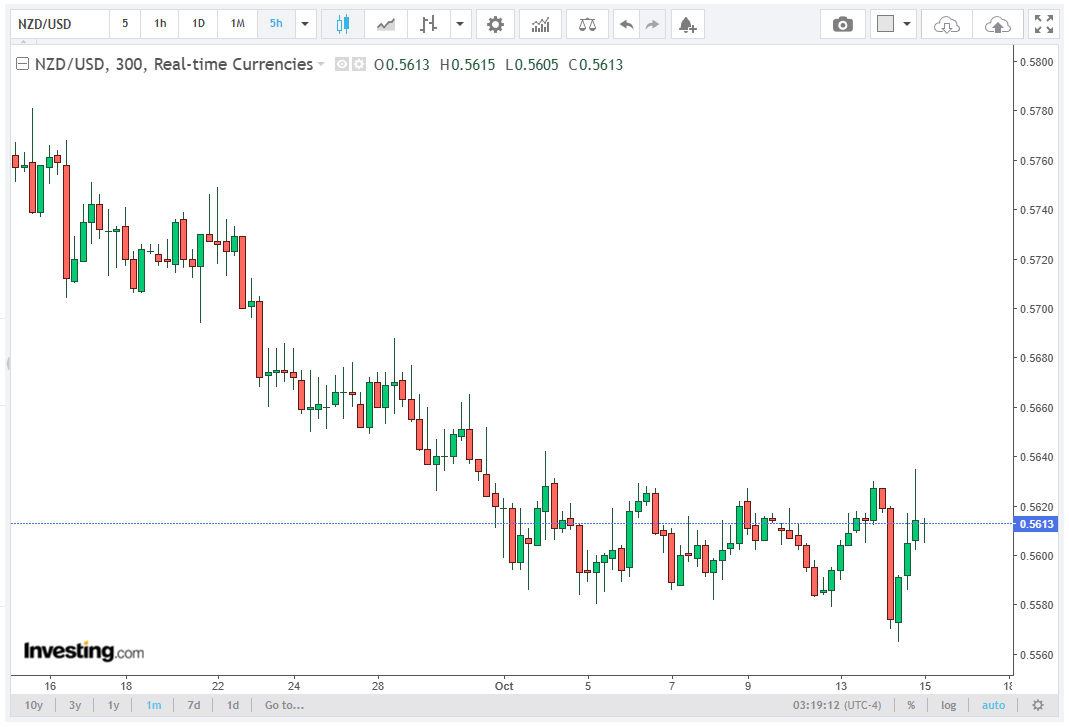
The NZD/USD pair advances toward 0.5605 during the recent European session, supported by a weaker US Dollar (USD) and falling US Treasury yields. However, the broader technical outlook remains bearish, with the pair trading below the 20-day Simple Moving Average (SMA) and the key 100-day SMA.
The current recovery appears to be a corrective rebound rather than a confirmed trend reversal. Dive into Rubinax’s expert analysis to gain a deeper understanding of this subject.
Traders are awaiting US Producer Price Index (PPI) and Retail Sales data for further clues about the Federal Reserve’s (Fed) monetary policy. Stronger-than-expected figures could support the USD, while weaker readings may push Treasury yields lower and extend the pair’s recovery.
US Inflation Increases Rate Hike Expectations
US inflation data have reinforced concerns about persistent price pressures. The Consumer Price Index (CPI) rose by 0.6% month over month, lifting annual inflation to 3.7%, above expectations of 3.6%.
Meanwhile, core CPI, excluding food and energy, increased by 0.3% monthly and 2.6% annually, exceeding forecasts of 0.2% and 2.5%, respectively. The figures suggest that underlying inflation remains persistent and continues to complicate the Fed’s progress toward its 2% inflation target.
Following the release, markets raised the implied probability of a Fed rate hike during the month to 29.3%, up from 22% previously, according to the CME FedWatch Tool. This represents an increase of 7.3 percentage points.
Higher interest-rate expectations typically support the USD by increasing the attractiveness of dollar-denominated assets. Nevertheless, falling Treasury yields have limited immediate dollar demand, allowing NZD/USD to remain above 0.5600.
Fed Outlook Remains Hawkish but Cautious
Federal Reserve officials indicate that further tightening remains possible, although policymakers are monitoring incoming economic data before making additional decisions. Persistent inflation and a resilient labor market support a cautious approach to easing monetary conditions.
The FXS Fed Sentiment Index declined by 0.84 points to 128.17, remaining above the neutral threshold of 100. This indicates that the overall policy outlook remains hawkish, despite a modest reduction in perceived hawkishness.
For NZD/USD, stronger US economic data could reinforce expectations of higher interest rates and renew selling pressure. Weaker releases could reduce tightening expectations, weaken the USD, and support a technical recovery.
Technical Analysis: Bearish Momentum Persists
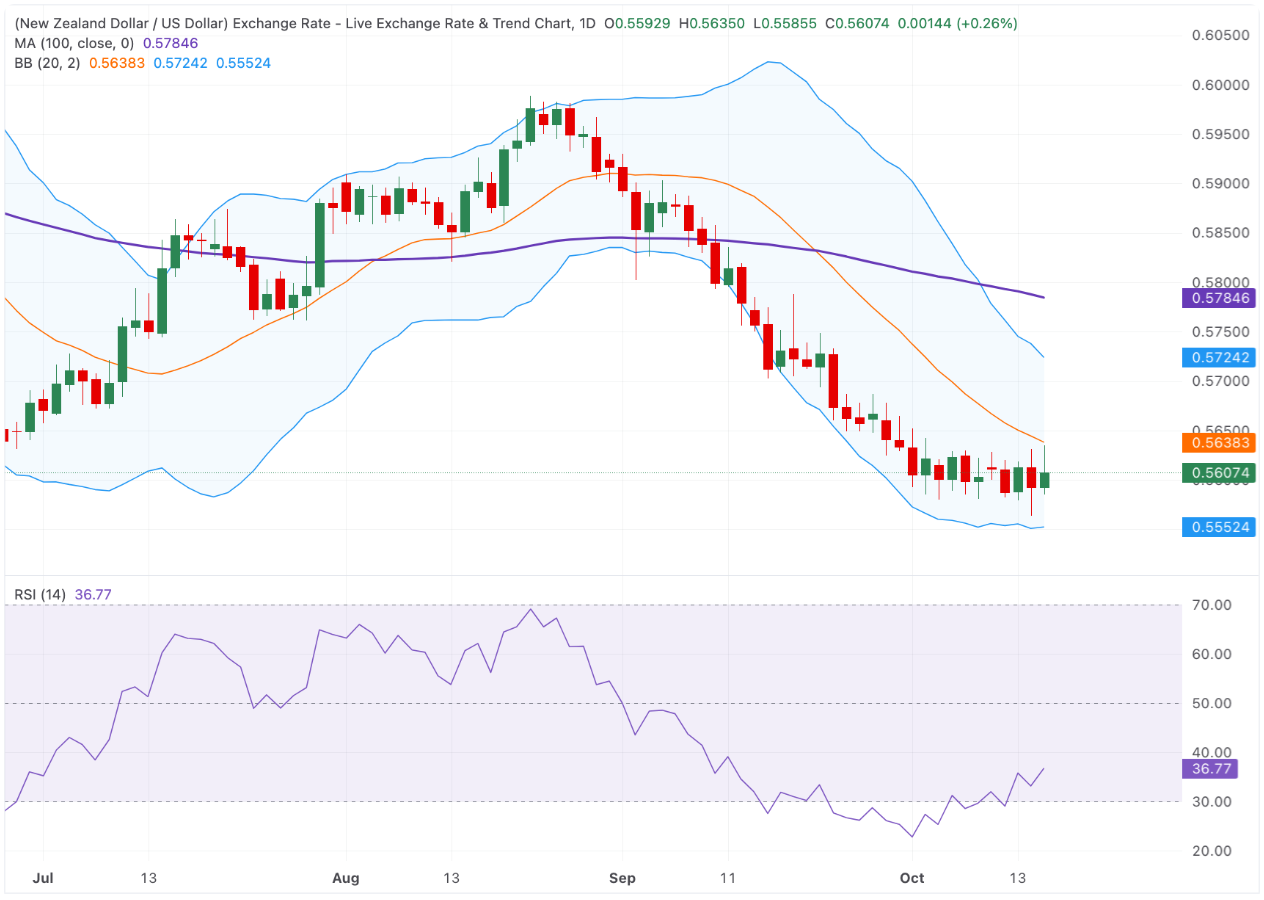
On the daily chart, NZD/USD remains below both the 20-day SMA and the 100-day SMA, indicating that the prevailing downtrend remains intact. The pair’s latest rebound has yet to overcome significant technical resistance.
The 14-period Relative Strength Index (RSI) stands near 36, below the neutral 50 threshold and approaching the conventional oversold level of 30. This reading confirms that bearish momentum dominates, although downside pressure may be moderating.
A decline below 30 would signal stronger selling momentum but could also increase the likelihood of a short-term rebound. An RSI recovery above 50, supported by rising prices, would indicate improving bullish momentum.
The Bollinger Bands identify key trading boundaries: the lower band near 0.5550, the middle band around 0.5640, and the upper band near 0.5725. Trading below the middle band reinforces the pair’s negative near-term bias.
Downside Targets: 0.5550, 0.5520, and 0.5500
The first major support lies at 0.5550, corresponding to the lower Bollinger Band. A sustained hold above this level could encourage consolidation and short-covering.
However, a decisive daily close below 0.5550 would strengthen the bearish outlook and expose 0.5520, the previous swing-low area. Further losses could bring the 0.5500 psychological support level into focus.
A breakdown below 0.5500 would signal renewed selling pressure and potentially extend the downtrend. Traders should monitor daily closing prices and momentum confirmation to distinguish a genuine breakdown from temporary intraday volatility.
Upside Targets: 0.5640, 0.5725, and 0.5785
Initial resistance stands at 0.5640, where the middle Bollinger Band could restrict further gains. A sustained break above this level would improve short-term momentum and expose 0.5725, near the upper Bollinger Band.
Further appreciation would bring the 100-day SMA at 0.5785 into focus. This represents a significant medium-term resistance barrier. A sustained move above 0.5785 would weaken the broader bearish structure and potentially signal a shift toward a neutral or bullish outlook.
Conclusion
The NZD/USD outlook remains bearish above 0.5600, despite support from a weaker USD and declining Treasury yields. Elevated inflation and a 29.3% probability of a Fed rate hike maintain downside risks, while the RSI near 36 confirms persistent bearish momentum.
A break below 0.5550 could expose 0.5520 and 0.5500, whereas a sustained move above 0.5640 could extend the recovery toward 0.5725. Only a decisive break above the 100-day SMA at 0.5785 would materially weaken the prevailing bearish bias.