
West Texas Intermediate (WTI) trades near $93.25, down less than 1.0% during the Asian session, after retreating from an intraday peak near $95.00. The decline interrupts a five-session winning streak that propelled US crude oil prices to an over two-week high.
However, the subsequent rebound from the session’s low indicates that buying interest remains concentrated around key Fibonacci support. Learn more about this topic through the expert insights shared by Rubinax in this article.
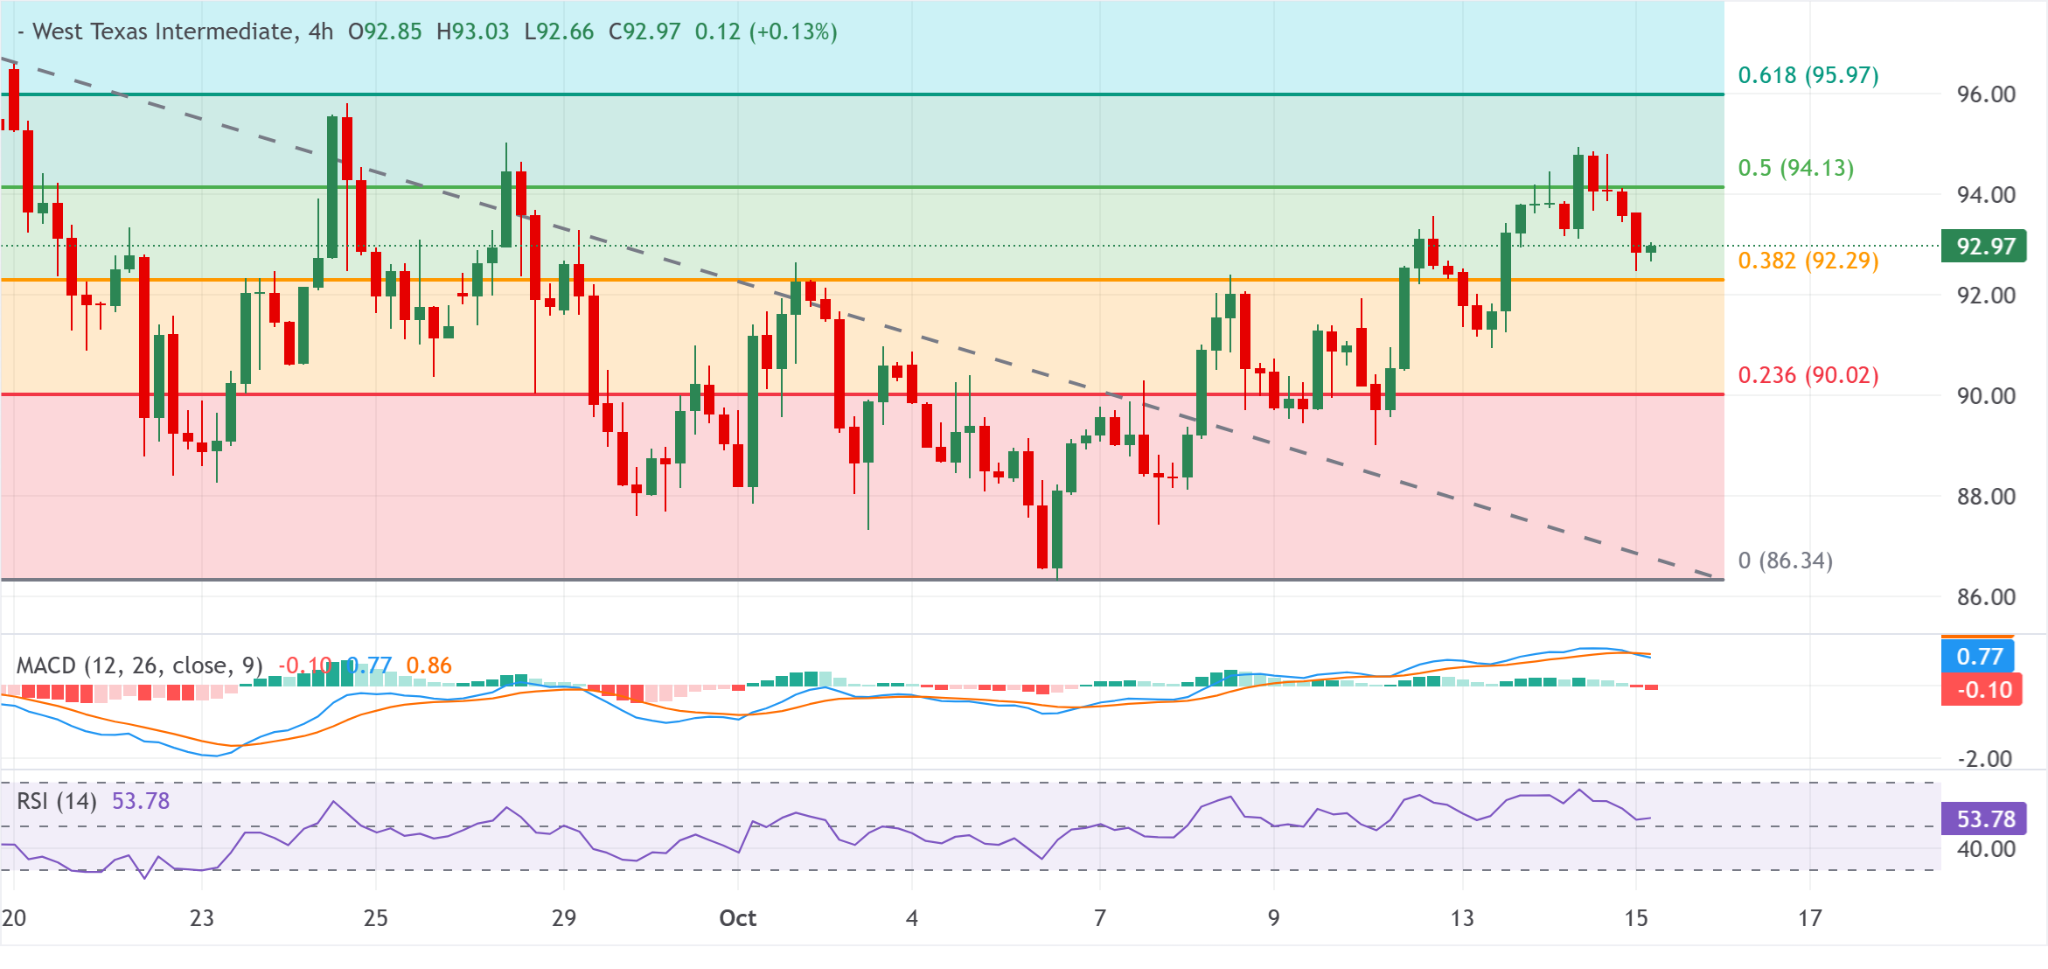
The inability to sustain gains above the psychological $95.00 threshold suggests short-term exhaustion following the latest recovery. Nevertheless, the rejection of lower prices near the 38.2% Fibonacci retracement at $92.29 prevents the technical structure from turning decisively bearish.
From a market-structure perspective, WTI remains within a corrective recovery phase following its monthly trough. The immediate outlook therefore depends on whether buyers can defend $92.29 and drive prices through the 94.13-95.00 resistance region.
Until either boundary is decisively breached, range-bound price action and elevated volatility remain plausible scenarios.
Fibonacci Analysis: $92.29 Is the Critical Technical Threshold
The Fibonacci retracement structure provides the principal framework for assessing WTI’s near-term trajectory. Following its recovery from the monthly low, crude oil approached the 50.0% retracement at $94.13 but failed to sustain upward momentum. The resulting correction subsequently tested the 38.2% retracement at $92.29, where selling pressure eased.
The price differential between these two retracement levels is $1.84 per barrel, defining an immediate technical range. A sustained move above $94.13 would indicate renewed demand and potentially expose the 61.8% retracement at $95.97, approximately $2.72 above the 38.2% support.
Beyond $95.97, the next resistance levels stand at $98.59 and the cycle high near $101.93. A breakout above the latter would strengthen the broader bullish structure and suggest that buyers have regained control of the medium-term price trajectory.
On the downside, a confirmed breach of $92.29 would weaken the recovery pattern and expose the 23.6% retracement at $90.02. This represents a decline of approximately 2.46% from $92.29. Further deterioration could extend losses toward $86.34, a structural support zone that would become relevant if selling pressure accelerated.
MACD and RSI Indicate Weakening Momentum but No Confirmed Breakdown
Momentum indicators deliver mixed signals. The Moving Average Convergence Divergence (MACD) has moved into negative territory, indicating that short-term bearish momentum is increasing relative to the preceding advance.
This configuration raises the probability of additional consolidation or a deeper correction if WTI remains capped below $94.13.
However, the Relative Strength Index (RSI) near 54 remains within neutral territory. The reading is above the conventional 50 midpoint, indicating that the broader momentum balance has not shifted decisively in favor of sellers. It also remains well below the commonly monitored 70 overbought threshold, leaving room for further upside if fresh buying emerges.
The divergence between a negative MACD and a neutral RSI suggests momentum deterioration without definitive bearish confirmation. A stronger downside signal would require a sustained break below $92.29, ideally accompanied by an RSI decline below 50 and continued negative MACD readings.
A recovery above $94.13, supported by improving momentum and stronger buying pressure, would weaken the immediate bearish case and increase the likelihood of a renewed move toward higher resistance levels.
A sustained break above this threshold would also suggest that buyers are regaining control, potentially shifting the short-term outlook toward a more constructive stance, provided that momentum indicators confirm the improvement.
WTI Forecast: Breakout Confirmation Determines the Next Move
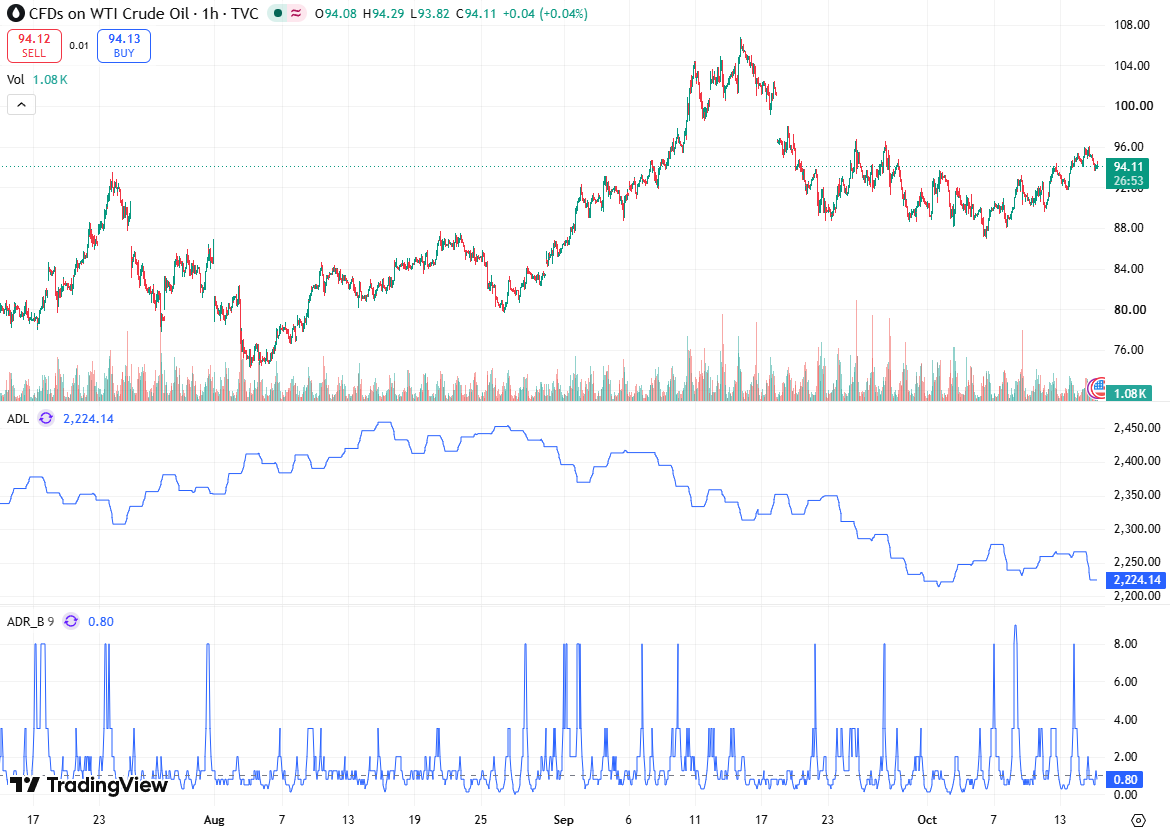
The short-term outlook remains cautiously bullish to neutral while WTI holds above $92.29. A recovery through $94.13 could trigger renewed buying toward $95.97, with subsequent resistance at $98.59 and $101.93. These upside scenarios require confirmation through sustained price acceptance above resistance rather than a brief intraday spike.
Alternatively, a decisive close below $92.29 would shift the technical balance toward sellers, placing $90.02 in focus before the deeper support at $86.34. The negative MACD supports caution, although the neutral RSI and persistent geopolitical risk premium argue against assuming an immediate bearish continuation.
Conclusion
WTI’s rebound above $93.00 preserves the broader recovery structure, but the failure near $95.00 and negative MACD indicate that upside momentum is moderating. The $92.29 Fibonacci support remains the pivotal level, separating continued consolidation from a potentially deeper correction toward $90.02 and $86.34.
A break above $94.13 would restore bullish momentum and expose $95.97, followed by $98.59 and $101.93.
Until price breaks decisively beyond these technical boundaries, confirmation, momentum alignment, and geopolitical developments will remain central to assessing WTI’s next directional move.