
Semiconductor shares have entered a tougher phase after months of strong gains. The Philadelphia Semiconductor Index finished Friday more than 20% below its June 22 record, confirming a technical bear-market decline after three losing sessions.
Brokers from AchievementsAI.com examine whether the pullback is settling or whether concerns about valuations, spending, and crowded positions could push the index lower.
The Recent Selloff Changed the Chart
The index climbed rapidly as investors backed companies linked to data centers, advanced computing, and artificial-intelligence infrastructure. That enthusiasm has cooled, leaving a steep decline from its late-June high.
A fall of more than 20% from a peak is commonly treated as bear-market territory. On Friday, the index ended 1.6% lower and had earlier traded as much as 23.5% below its record close.
The 20-day Exponential Moving Average remains above the current price. Reclaiming it would be an early sign that buyers are returning.
The 50-day EMA carries more weight. While the index remains beneath it, any rebound may look corrective rather than the start of a new upward trend.
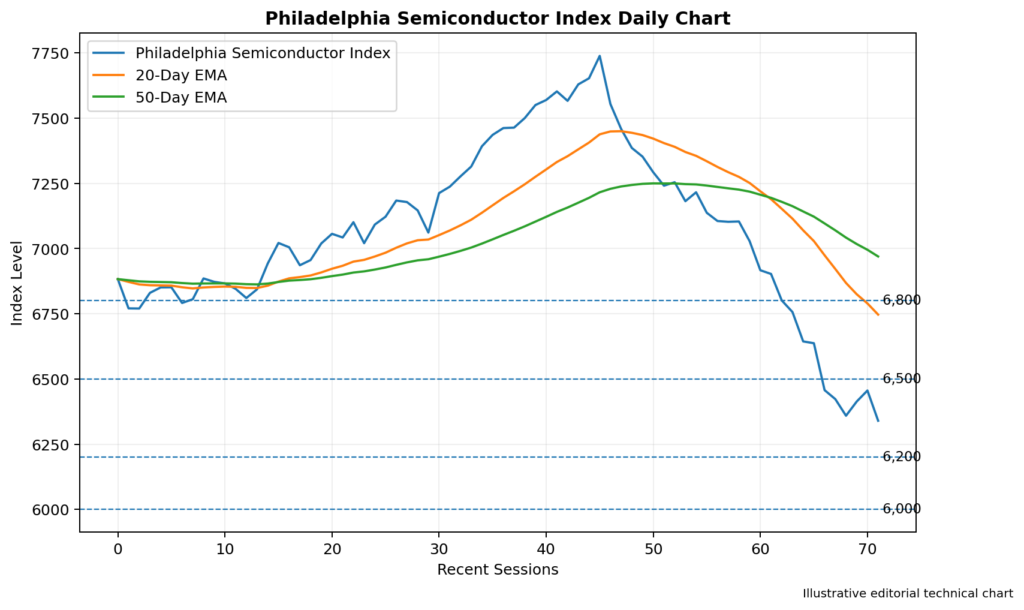
Image 1: Philadelphia Semiconductor Index Daily Chart With the 20-Day and 50-Day EMAs, Support Near 6,000 and Resistance Around 6,500
RSI May Be Near an Oversold Area
The 14-day Relative Strength Index has weakened alongside the decline.
A reading below 30 would indicate oversold conditions. That can attract short-term buyers, but it does not guarantee a lasting bottom.
A recovery above 40, followed by a move through 50, would suggest momentum is shifting away from sellers.
Bullish divergence may also matter. If the index makes a lower low while RSI forms a higher low, selling pressure could be easing.
Support Levels Come Into Focus
The first area to watch is around 6,200, where buyers may try to slow the decline.
Below that, the psychological 6,000 level becomes more important. A firm break beneath it would suggest the correction is still developing.
Further support may appear near 5,800, followed by approximately 5,500.
The main support levels are 6,200, 6,000, 5,800, and 5,500.
Resistance Could Limit an Early Rebound
An initial recovery may meet resistance around 6,500. This area could contain earlier buyers waiting to reduce positions.
A sustained move above 6,500 may bring 6,800 into view. Beyond that, the index would need to reclaim approximately 7,000 before the technical picture looks more convincing.
A return toward 7,400 to 7,500 would require stronger earnings, renewed confidence in capital spending, and broader sector participation.
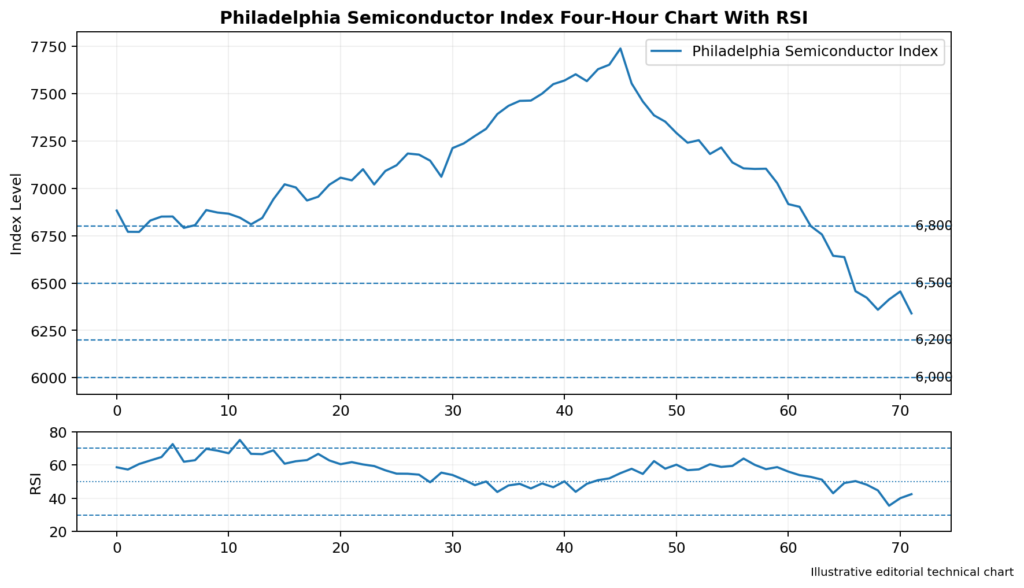
Image 2: Philadelphia Semiconductor Index Four-Hour Chart With RSI, Support at 6,200 and 6,000, and Resistance at 6,500 and 6,800
Earnings Could Decide the Next Move
Investors are waiting for second-quarter results from several major technology and semiconductor businesses. Reports from Intel and Texas Instruments are expected to receive particular attention.
The main question is whether spending on computing infrastructure is still growing quickly enough to justify current valuations.
If earnings show that investment remains high while returns take longer to appear, the selloff could continue. Stronger revenue growth or more confident guidance may encourage buyers to return.
Caution Has Spread Beyond the United States
The weakness has not been limited to Wall Street. China’s STAR Market, which includes many large semiconductor companies, has fallen roughly 25% from its July 1 peak, wiping out more than 4 trillion yuan, or about $590 billion, in market value.
Institutional demand for a major Chinese memory-chip listing remained strong but was less intense than during earlier technology offerings. Its allocation was approximately 570 times oversubscribed, compared with more than 5,000 times for some recent listings.
Investors have not abandoned the sector, but they are approaching it more carefully.
Wider Markets Feel the Pressure
The chip decline helped pull major US indexes lower last week. On Friday, the Nasdaq Composite fell 1.40% to 25,520.24, while the S&P 500 dropped 1.01%. The Nasdaq lost 2.9% across the week.
Stock futures recovered slightly on Monday, with Nasdaq 100 futures gaining around 0.4%.
Trading Implications
The semiconductor index remains technically weak while trading below its main moving averages.
A recovery above 6,500 could open the way toward 6,800 and 7,000. Improving RSI would make that rebound more convincing.
A break below 6,000 would increase the risk of losses toward 5,800 or 5,500.
Conclusion
Semiconductor shares are testing whether the recent decline has gone far enough to attract buyers.
Support is positioned at 6,200, 6,000, 5,800, and 5,500. Resistance can be found near 6,500, 6,800, and 7,000.
The sector still benefits from strong long-term demand, but earnings and spending guidance now matter more than enthusiasm alone. The reaction around 6,000 may show whether the correction is stabilizing or has another leg lower.