
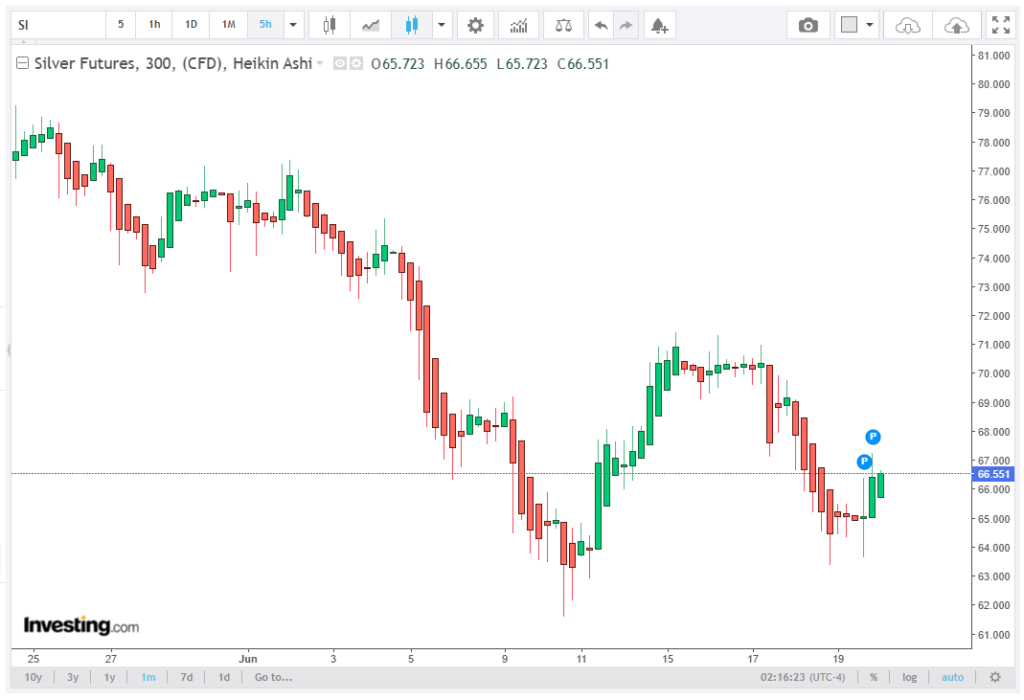
Silver (XAG/USD) trades higher in early Monday European activity, reaching approximately $66.35, extending a corrective intraday rebound after recent downside pressure. Despite the upward movement, the broader market structure remains clearly bearish on a multi-session and daily basis, with price still operating well below key dynamic resistance zones.
Readers looking for additional insights can find a comprehensive discussion from Fonndure’s brokerage specialists in this related article.
The current advance is best characterized as a technical retracement within a dominant downtrend, rather than a structural reversal. The market continues to trade beneath the 20-period Bollinger simple moving average on the daily chart and remains significantly below the 100-day simple moving average (SMA) at $76.90, confirming a sustained negative medium-term bias.
Trend Structure: Bearish Alignment Below Key Moving Averages
The dominant technical configuration remains bearish, driven by sustained trading below multiple-layered resistance indicators.
The 100-day SMA at $76.90 continues to act as a primary structural ceiling, with price currently trading more than $10 below this threshold, underscoring the depth of the corrective phase. Below the shorter-term structure, the 20-period Bollinger mid-band near $70.18 further reinforces overhead supply, creating a stacked resistance zone between $70.18 and $76.90.
This alignment of moving averages confirms a descending trend regime, where rallies into resistance zones are consistently met with supply absorption rather than breakout continuation.
Momentum Conditions: RSI Reflects Weak but Stabilizing Pressure
The Relative Strength Index (RSI 14) is currently positioned near 40–42, reflecting a market that is neither oversold nor recovering sufficient bullish momentum to signal reversal conditions.
This RSI reading indicates weak downside momentum exhaustion, suggesting that selling pressure is beginning to slow. However, there is still no clear evidence of a strong bullish divergence that would be sufficient to confirm a trend reversal.
Overall, the momentum regime remains neutral to bearish, as RSI is still trading below the 50 equilibrium zone. Historically, RSI values below 45 in trending environments tend to support the continuation of corrective phases, particularly when they align with price trading beneath major moving averages.
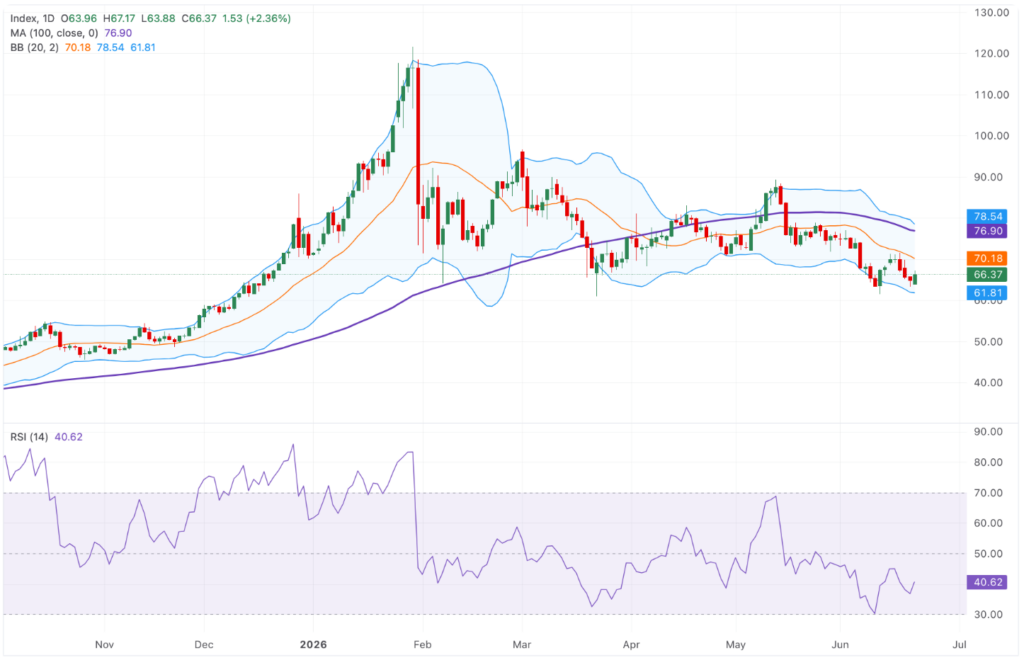
The lack of a sustained RSI recovery above the 50–55 area further confirms that bullish momentum has not yet become structurally established.
Resistance Architecture: Multi-Layered Supply Zones
The immediate resistance structure is clearly defined and technically significant.
The first barrier is located at $70.18, corresponding to the Bollinger mid-band, which acts as a dynamic equilibrium level between bullish and bearish pressure. A sustained move above this level would be required to neutralize the current short-term bearish bias.
Above this threshold, the next resistance level is positioned at $71.56, representing the most recent local swing high. This level acts as a liquidity checkpoint, where prior rally attempts have failed to sustain momentum.
Beyond these levels, the medium-term resistance cluster includes:
The 100-day SMA at $76.90, representing the primary structural trend barrier, and the upper Bollinger band near $78.55, which marks the upper volatility envelope of the current range.
The distance between the current price ($66.35) and the 100-day SMA ($76.90) reflects a ~15.9% gap, highlighting the scale of recovery required to shift the broader trend from bearish to neutral.
Until price reclaims at least $70.18, the structure remains decisively tilted toward resistance-driven rejections.
Support Structure: Critical Levels Define Downside Risk
On the downside, silver maintains a clearly defined support framework, with the most immediate structural floor located at the lower Bollinger band around $61.80.
This level represents the first major volatility boundary, where historical price compression has previously triggered short-term stabilization. A sustained break below this zone would indicate trend continuation acceleration, rather than corrective consolidation.
Below this level, the next structural reference is the June 11 swing low at $61.50, which acts as a key breakdown trigger. A decisive move under $61.50 would confirm a deeper bearish extension phase, potentially initiating a new downside leg within the broader cycle.
The current trading range between $61.80 and $70.18 defines a high-probability consolidation corridor, with directional breakout potential dependent on volatility expansion.
Technical Outlook: Bearish Bias Intact Below $70.18
Overall structure confirms that XAG/USD remains in a broader corrective downtrend, with price still trading below all major medium-term trend indicators.
As long as the price remains below $70.18, the market retains a bearish-to-neutral configuration, with upside moves likely to face layered supply pressure.
A transition toward a neutral structure would require sustained acceptance above the 20-period Bollinger mid-band, while a full trend reversal would require a breakout above the 100-day SMA at $76.90, accompanied by RSI expansion above 55–60.
Until such conditions materialize, silver remains positioned within a controlled corrective downtrend with reactive upside movements and structurally defined resistance ceilings.