
XRP has experienced renewed selling pressure after encountering a major resistance zone between $1.36 and $1.39, with the rejection erasing previous gains and driving the price toward $1.31. The sharp reversal suggests that sell-side liquidity, profit-taking, and bearish positioning are exerting considerable influence over short-term price action.
This article provides an in-depth exploration of the topic, backed by Raymin Group’s industry expertise and professional insights.
The rejection occurred near the 200-period exponential moving average (EMA) on the 4-hour chart, a technical indicator that emphasizes recent price data and helps traders identify dynamic support and resistance.
XRP’s inability to sustain a move above this indicator suggests that overhead supply remains elevated. The decline from $1.39 to $1.31 represents a drop of approximately 5.76%, demonstrating the strength of the selling response.
The rapid reversal also suggests that leveraged traders may have been forced to reduce exposure as prices moved against their positions.
The immediate technical structure remains vulnerable while XRP trades below $1.36. A sustained recovery above this threshold would require stronger spot demand, increasing buying volume, and evidence that sellers are losing control.
XRP Futures Data Reveals Increasing Bearish Positioning
Derivatives-market positioning provides further insight into XRP sentiment. According to CoinGlass data, the long-to-short ratio declined to approximately 0.71, its second-lowest reading in roughly 45 days.
A ratio of 0.71 indicates that measured positioning favors short exposure over long exposure, depending on the data provider’s methodology. This decline suggests that derivatives traders increasingly anticipate further weakness or are reducing their bullish exposure.
An earlier decline in the ratio to approximately 0.59 coincided with XRP falling from $1.30 to $1.26, a decrease of approximately 3.08%. This historical comparison identifies $1.26 as a significant support level, although past price movements cannot guarantee a similar outcome.
XRP Price Prediction: The $1.31 and $1.29 Support Levels
The $1.31 level represents the first important threshold for determining whether XRP’s decline will extend. Its ability to attract sufficient buying demand will influence the probability of a further breakdown.
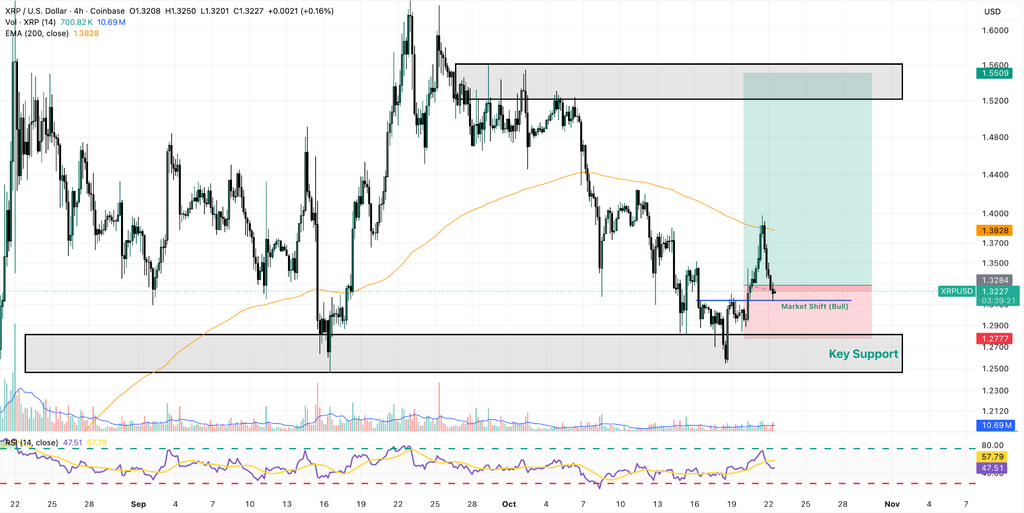
A decisive four-hour candle close below $1.31, particularly alongside increasing sell volume, would strengthen the bearish outlook. Under this scenario, the next downside target would be approximately $1.29, representing a potential decline of 1.53% from $1.31.
If XRP breaks below $1.29, traders will likely monitor the $1.26 support zone. A decline from $1.31 to $1.26 would amount to approximately 3.82%, while a drop from $1.39 to $1.26 would represent a correction of approximately 9.35%.
The $1.26 area is particularly significant because it previously attracted buying interest. A successful defense could trigger a technical rebound, allowing XRP to consolidate between $1.26 and $1.36 while the market establishes a new short-term range.
A sustained breakdown below $1.26 would invalidate this support structure and increase the risk of a deeper correction toward 1.10-1.00. From $1.26, these targets imply potential additional declines of approximately 12.70% to 20.63%. These projections remain conditional on a confirmed support failure.
RSI Momentum and the 200 EMA Confirm Technical Weakness
The Relative Strength Index (RSI) has reportedly fallen below its signal line, indicating that short-term momentum is weakening. This crossover suggests that recent price declines are gaining influence, reinforcing the bearish implications of XRP’s rejection near the 200 EMA.
The RSI should be evaluated alongside its absolute reading, price structure, and trading volume. A reading below 50 generally indicates weaker momentum, while a reading below 30 is conventionally associated with oversold conditions. Neither threshold guarantees a reversal or continued selling.
For XRP, the combination of resistance rejection, a declining long-to-short ratio, and weakening RSI momentum creates a technically bearish configuration. Confirmation would be stronger if the price establishes consecutive lower highs and lower lows while selling volume increases.
A recovery above $1.36 would weaken this interpretation. A subsequent breakout above $1.39, supported by sustained buying volume, would provide additional evidence that bearish pressure is easing.
Conclusion: XRP Faces Elevated Downside Risk Below $1.36
XRP remains technically vulnerable following its rejection from the 1.36-1.39 resistance zone. The 200-period EMA, a futures long-to-short ratio of 0.71, and weakening RSI momentum support a bearish short-term assessment.
A confirmed break below $1.31 could expose $1.29 and subsequently $1.26, while a decisive loss of $1.26 would place the 1.10-1.00 range in focus. A sustained recovery above $1.36 and a breakout through $1.39 would challenge the bearish scenario.
Traders should prioritize four-hour candle closes, volume confirmation, liquidation data, and derivatives positioning, recognizing that price targets are conditional scenarios rather than guaranteed outcomes.