
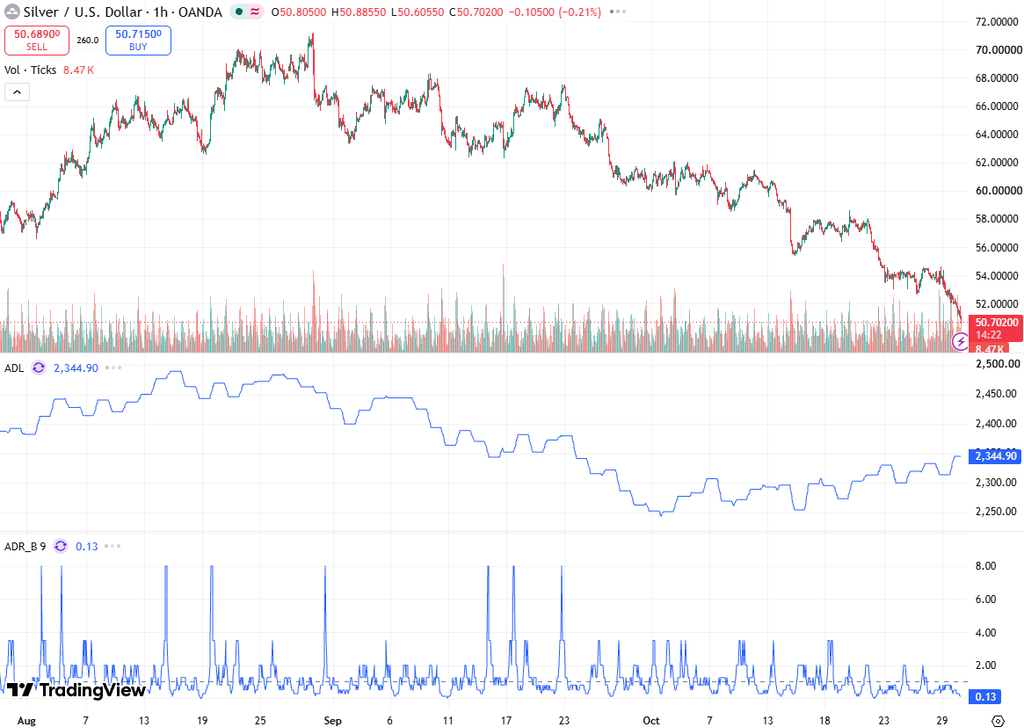
Silver (XAG/USD) remains under substantial selling pressure, extending its decline for the third consecutive trading session and recording a fresh low since November 2025 during the recent Asian session.
Leveraging Aurelstein’s industry expertise, this article delivers a deeper understanding of the topic.
The white metal briefly approached the $51.00 psychological threshold before recovering toward the 51.50-51.55 region. Despite this stabilization, XAG/USD remains approximately 1.25% lower, reflecting persistent negative short-term momentum.
The latest price action highlights a deterioration in silver’s technical structure, with sellers maintaining control. The inability to sustain rebounds indicates that buying demand remains insufficient to absorb selling pressure. Furthermore, successive lower highs and lower lows reinforce the bearish market structure and increase the probability of further depreciation.
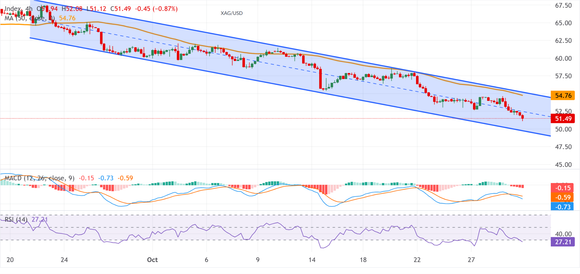
Recently, silver’s decline has developed within a well-defined descending parallel channel. Price movements between its upper and lower boundaries confirm an established downward trajectory. As long as XAG/USD remains below the channel’s mid-range and upper boundary, the prevailing technical bias favors sellers.
RSI and MACD Confirm Negative Momentum Despite Oversold Conditions
Momentum indicators continue to reflect a predominantly bearish configuration. The Relative Strength Index (RSI) currently stands at 27.21, significantly below the neutral 50 threshold and beneath the conventional 30 oversold boundary.
This reading indicates that downside momentum has become stretched, increasing the probability of a short-term technical rebound. An RSI recovery toward 30–35 could indicate an initial moderation in selling pressure, while a subsequent move toward 40 would provide stronger evidence of improving momentum without independently confirming a bullish reversal.
Meanwhile, the Moving Average Convergence Divergence (MACD) remains in negative territory, confirming that downside momentum continues to dominate. The absence of a confirmed bullish crossover reinforces the prevailing negative technical outlook.
The combination of an oversold RSI and negative MACD is particularly important. While the RSI highlights stretched selling conditions, the MACD indicates that the underlying trend remains bearish. This configuration favors a corrective rebound within an established downward trend rather than an immediate bullish reversal.
Immediate Resistance Concentrated Between $52.00 and $53.00
On the upside, the $52.00 psychological level represents the first resistance threshold buyers must reclaim to stabilize the short-term price structure. A sustained move above this level could trigger initial short-covering activity and allow XAG/USD to test the 52.50-52.55 resistance zone.
This region represents an important supply area where renewed selling interest could emerge. A rejection would preserve the sequence of lower highs and reinforce the prevailing descending channel formation.
Above $52.55, the $53.00 resistance level becomes the next technical reference. A decisive breakout, supported by improving momentum and stronger buying participation, could extend the recovery toward $54.00.
Further bullish continuation would expose the channel’s upper boundary near $54.52, followed by the 50-period Simple Moving Average (SMA) at $54.76. These indicators create a significant resistance cluster between $54.52 and $54.76.
A sustained daily recovery above the $54.76 moving average would represent a meaningful improvement in the technical outlook. Such a development could invalidate the immediate bearish continuation scenario and increase the probability of a broader recovery.
$51.00 Breakdown Could Accelerate Losses Toward $49.07
On the downside, $51.00 remains the immediate support reference. A confirmed breakdown below this threshold, particularly alongside expanding bearish momentum, would expose silver to additional losses.
The next downside objective stands at $50.00, a major psychological support level that could temporarily interrupt the decline. Sustained trading below this threshold would expose the lower boundary of the descending parallel channel near $49.07.
This area represents a technically significant support zone because it coincides with the channel’s lower boundary. A reaction around $49.07 could generate temporary stabilization or a technical rebound, particularly given the already oversold RSI conditions.
A decisive breakdown below $49.07, accompanied by continued negative momentum, would invalidate the immediate channel-support scenario and signal a potential acceleration of the broader bearish trend.
Conclusion: Bearish Structure Remains Intact Below $54.76
The technical outlook for XAG/USD remains decisively bearish, with silver extending its three-session decline toward the $51.00 support threshold. The descending parallel channel, negative MACD configuration, and formation of lower highs and lower lows continue to favor sellers.
Meanwhile, the RSI at 27.21 signals oversold conditions, increasing the probability of a temporary corrective rebound. Immediate upside barriers stand at $52.00, $52.55, and $53.00, while a stronger recovery requires a move above the 54.52-54.76 resistance cluster.
On the downside, a confirmed break below $51.00 could expose $50.00 and subsequently $49.07. Until XAG/USD reclaims its major moving-average resistance and establishes a higher-high structure, bearish continuation remains the dominant technical scenario, with near-term recoveries vulnerable to renewed selling pressure.