
Markets came into Wednesday June 17, 2026 braced for the Federal Reserve’s first policy decision under new Chair Kevin Warsh. What they got was a unanimous hold on rates and a statement short enough to fit on a napkin.
The Fed’s post-meeting release totaled just 130 words, the most compressed policy statement in decades. A senior financial analyst at Gammance says the brevity itself was the message, and one that equity investors have not yet fully processed heading into the second half of 2026.
The Fed held its benchmark overnight borrowing rate steady in the 3.50% to 3.75% range. The vote was 12 to 0, a sharp reversal from the 8 to 4 dissent recorded at the April meeting. That unanimity sounds reassuring on the surface until you read the dot plot sitting directly underneath it and see where individual policymakers are positioning themselves on rates.
Why the Dot Plot Matters More Than the Vote
Nine of the 18 participating policymakers now forecast at least one rate hike by the end of 2026. Warsh, a vocal critic of the dot plot as a communication tool, declined to submit his own projection entirely. That abstention was noted immediately by traders and analysts alike, since it means the nine-member hawkish bloc could be understating where actual committee leadership sits on the rate question.
The shift from the March projection is striking. In March, the committee was debating the timing of cuts. By June 17, the internal conversation had rotated completely. Bank of America’s pre-meeting survey found that 55% of respondents expected Warsh to strike a hawkish tone in his first press conference. The data environment gave him every justification to do exactly that.
The Short Statement Strategy and What It Changes
Warsh has spent years publicly criticizing the Fed’s tendency to over-communicate through lengthy forward guidance.
His 130-word statement is the opening move of a deliberate strategy to reduce policy signaling and force markets to become more data-dependent rather than Fed-dependent. For investors accustomed to parsing paragraph-level nuance from post-meeting statements, that is a genuine operational change in how the central bank communicates.
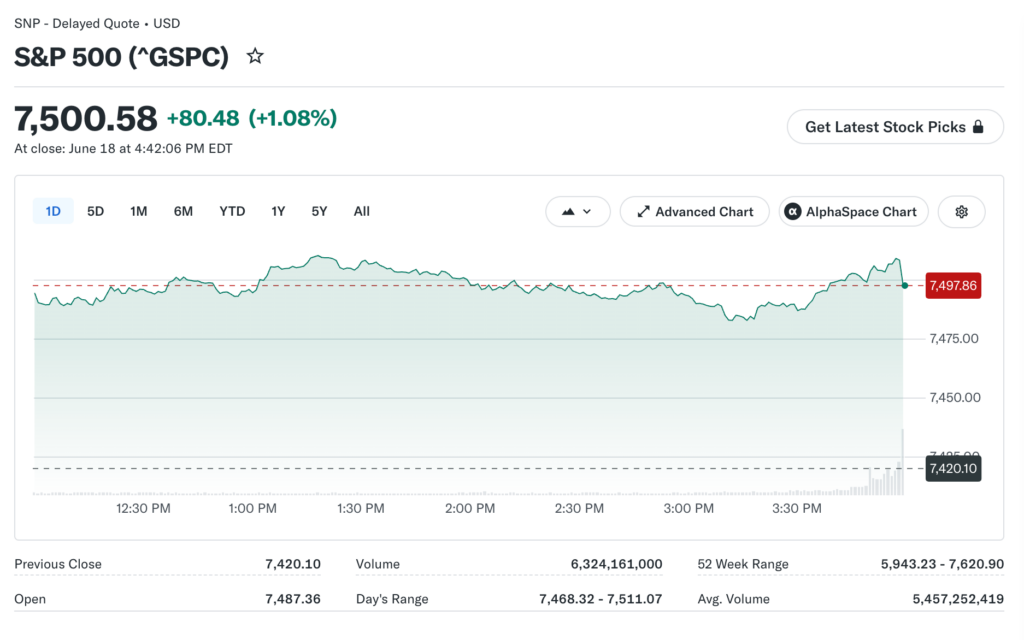
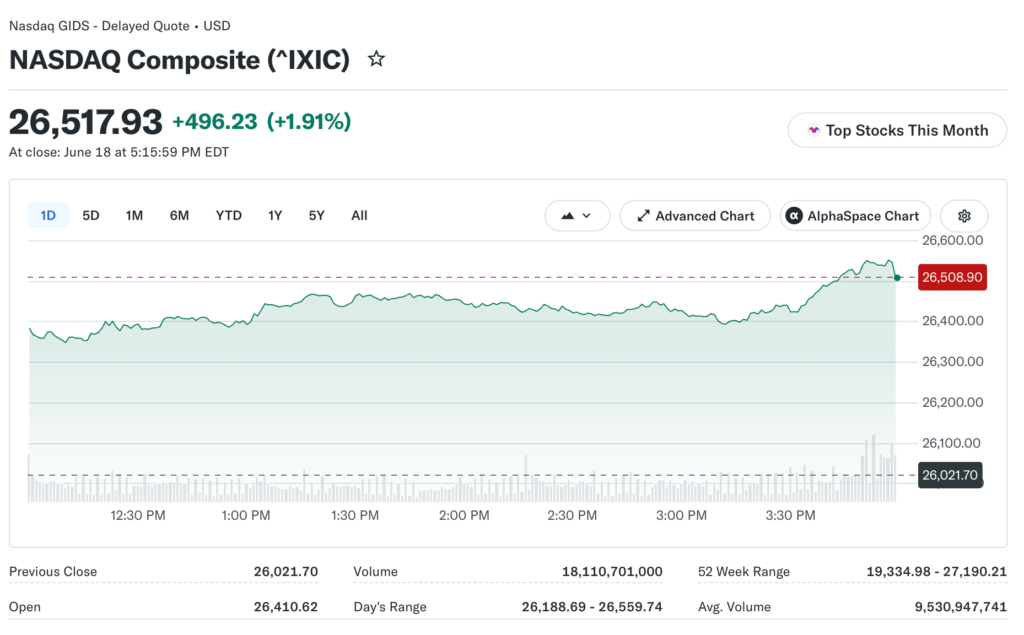
The practical effect is that every CPI print, every jobs report, and every PCE reading now carries more market weight than it did under the prior communication framework. The S&P 500 and Nasdaq both dropped sharply on June 17 after the decision was released, with the Nasdaq falling harder than the broader index. That reaction reflected the hawkish dot plot positioning more than the 130-word statement itself.
What Stocks Feel the Pressure First
Rate-sensitive sectors moved immediately after the decision. The percentage of S&P 500 stocks trading above their 50-day moving averages had been recovering slowly from late-March lows. After June 17, that indicator settled around 58%, still well below the 70% and 80% readings reached earlier in 2026 and the prior summer. Failing to reclaim 65% in the sessions ahead would signal that institutional positioning has shifted decisively toward defense.
Homebuilders, real estate investment trusts, and small-cap financials are the sectors most directly repriced when rate-hike expectations rise. The Russell 2000 had already been underperforming the Dow in the sessions leading up to the June 17 decision. If nine FOMC members are projecting hikes, those sectors face a sustained headwind that the ceasefire-driven relief rally in technology names cannot fully offset.
Tech Carries Too Much Weight to Hide Behind
Technology drove 19.76% sector gains in May 2026 while eight of eleven S&P sectors declined during the same month. That degree of concentration creates structural fragility that becomes visible on days like June 17 when the macro environment turns hostile to growth valuations. A narrow rally reverses faster than a broad one because there are fewer sectors available to absorb the selling pressure.
The Nasdaq’s decline on June 17 was driven partly by valuation mechanics specific to long-duration assets. Long-duration growth stocks reprice when discount rates rise even if underlying business performance is completely unchanged.
The dot plot signaling potential hikes by year-end is the clearest rate direction signal markets have received since 2022, and the equity market’s full repricing response to it is still playing out in real time.
Reading the Setup Before September Arrives
Warsh’s 130-word statement and dot-plot abstention point toward a Federal Reserve that intends to act on data rather than communicate its intentions in advance. The next quarterly projection meeting arrives in September 2026. Between now and then, the June CPI report due in mid-July and the July jobs report will be the two most critical data points for equity market positioning across all sectors.
Investors tracking semiconductor stocks, high-multiple technology names, and rate-sensitive financials should monitor those releases as closely as any quarterly earnings report. A June CPI surprise to the upside pushes hike probability higher and validates the hawkish dot plot reading that spooked markets on June 17.
A softer number gives Warsh room to hold and allows stretched technology valuations to stabilize heading into a Q3 earnings season that will carry more macro weight than usual.