
The US Dollar Index (DXY) continues to trade with a mild bearish bias in Tuesday’s European session, declining approximately 0.10% to around 100.90. The index is currently consolidating near the 20-day Exponential Moving Average (EMA) at 100.83, a key short-term trend indicator that continues to act as dynamic support.
Throughout this article, the brokers at BCR Limited delve deeper into the key aspects of this topic.
The recent decline in the US Dollar has been driven primarily by improving global risk sentiment, which has reduced demand for safe-haven currencies. Expectations of easing geopolitical tensions have encouraged investors to rotate into risk assets, with S&P 500 futures rising 0.45% toward 7,477, reflecting a stronger risk-on market environment.
Despite the intraday weakness, the DXY remains technically supported, with price action holding above important moving averages. The index continues to trade within a broader bullish structure, although momentum has moderated following its recent advance toward the 101.00 psychological zone.
US PMI Data Could Provide the Next Directional Catalyst
Market participants are now focused on the upcoming flash US S&P Global Purchasing Managers’ Index (PMI) data for July, which is expected to provide fresh insight into the strength of the US economy.
The Manufacturing PMI is forecast to improve to 54.5 from 53.9 in June, suggesting stronger expansion in the industrial sector. A reading above 50.0 indicates economic expansion, and a stronger-than-expected figure could reinforce expectations for continued economic resilience.
The Services PMI is projected to ease slightly to 51.0 from 51.2, indicating slower but still positive growth. Since the services sector represents a significant portion of US economic activity, any unexpected weakness could influence expectations regarding future Federal Reserve policy.
A stronger PMI release could support further gains in the DXY, especially if markets begin pricing in a more prolonged period of elevated interest rates from the Federal Reserve.
However, weaker-than-expected data may increase expectations for policy easing, potentially weighing on the index and pushing it below key technical support levels as investors reassess the outlook for US growth.
DXY Technical Analysis: Bullish Flag Pattern Remains Active
From a technical perspective, the US Dollar Index remains positioned inside a bullish continuation structure. The formation of a Bullish Flag pattern suggests that the current consolidation phase may represent a temporary pause before another potential upward move.
The index is currently trading around 100.90, slightly above the 20-day EMA at 100.83. Maintaining price action above this moving average is critical, as it indicates that short-term buyers continue to defend the prevailing bullish trend.
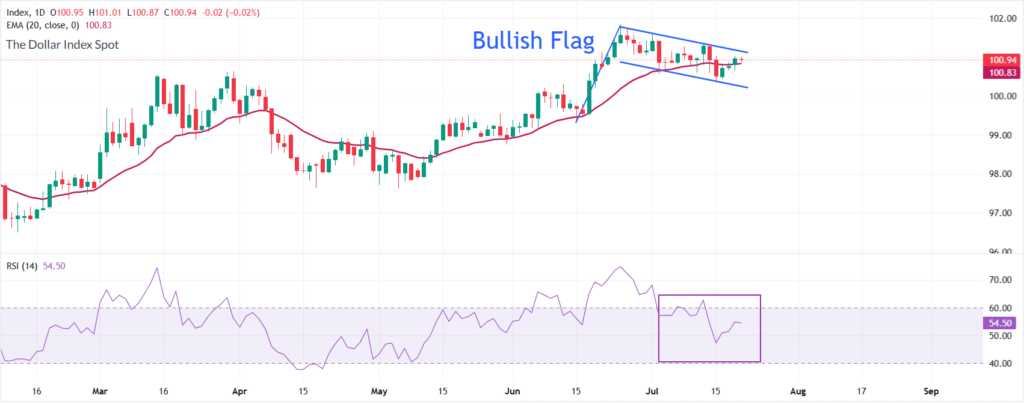
The Relative Strength Index (RSI 14) is positioned near 54.50, reflecting neutral-to-positive momentum. The indicator remains above the 50.00 midpoint, suggesting that bullish momentum has not disappeared, although the absence of an RSI reading above 60.00 highlights limited upside momentum in the immediate term.
A sustained hold above the 100.83 EMA zone would keep the bullish structure intact and increase the probability of a breakout attempt toward higher resistance levels.
Resistance and Support Levels Define the Next DXY Move
The immediate upside barrier for the Dollar Index is located near the channel resistance at 101.13. A confirmed breakout above 101.13, supported by stronger volume and momentum indicators, would strengthen the bullish outlook and expose the yearly high near 101.80.
On the downside, the first important support level remains the 20-day EMA at 100.83. A daily close below this area would weaken short-term bullish momentum and increase the probability of further consolidation.
The next major support zone is located near 100.23, corresponding with the lower boundary of the current price channel. A breakdown below 100.23 would invalidate the near-term bullish setup and suggest a deeper corrective decline toward lower technical levels.
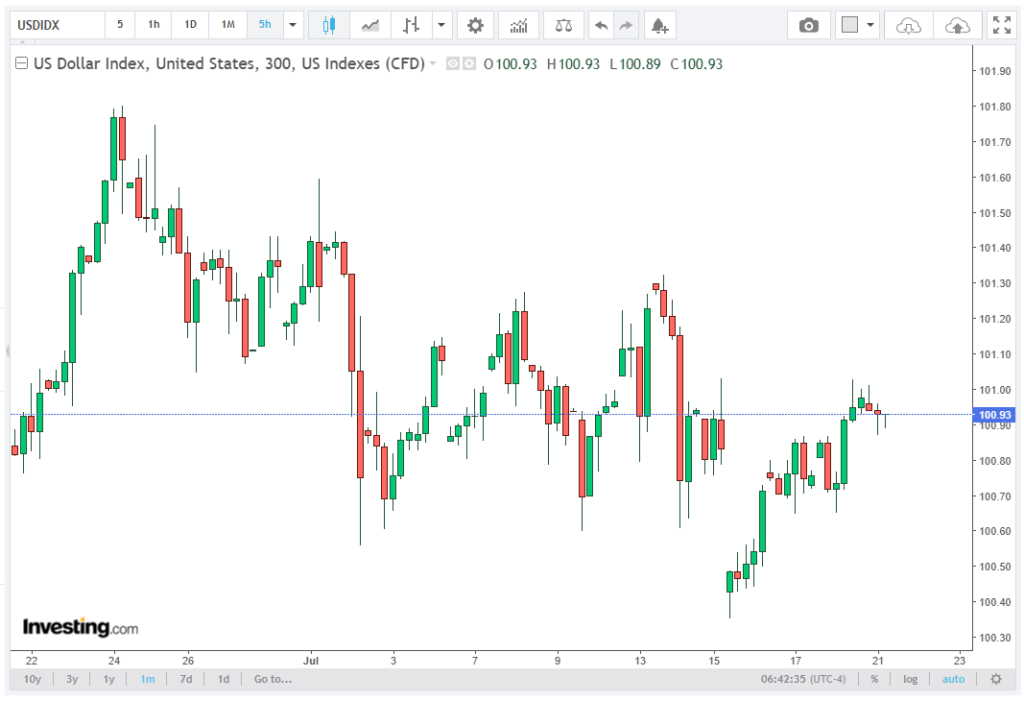
The current structure indicates that the 100.23–101.13 range is the key trading zone, with a breakout from either side likely determining the next directional trend.
US Dollar Index Outlook: Technical Bias Remains Positive Above 100.83
The US Dollar Index forecast remains cautiously bullish as long as the price holds above the 20-day EMA at 100.83. The combination of a developing Bullish Flag pattern, stable RSI momentum, and continued support from moving averages suggests that the broader uptrend remains technically valid.
The next major driver will be the upcoming US PMI data, which could determine whether the index regains momentum toward 101.13 and 101.80 or enters a deeper corrective phase below 100.83.
For now, the DXY remains range-bound but structurally supported, with traders watching the interaction between key technical levels, economic data, and changing global risk sentiment for confirmation of the next major move.