
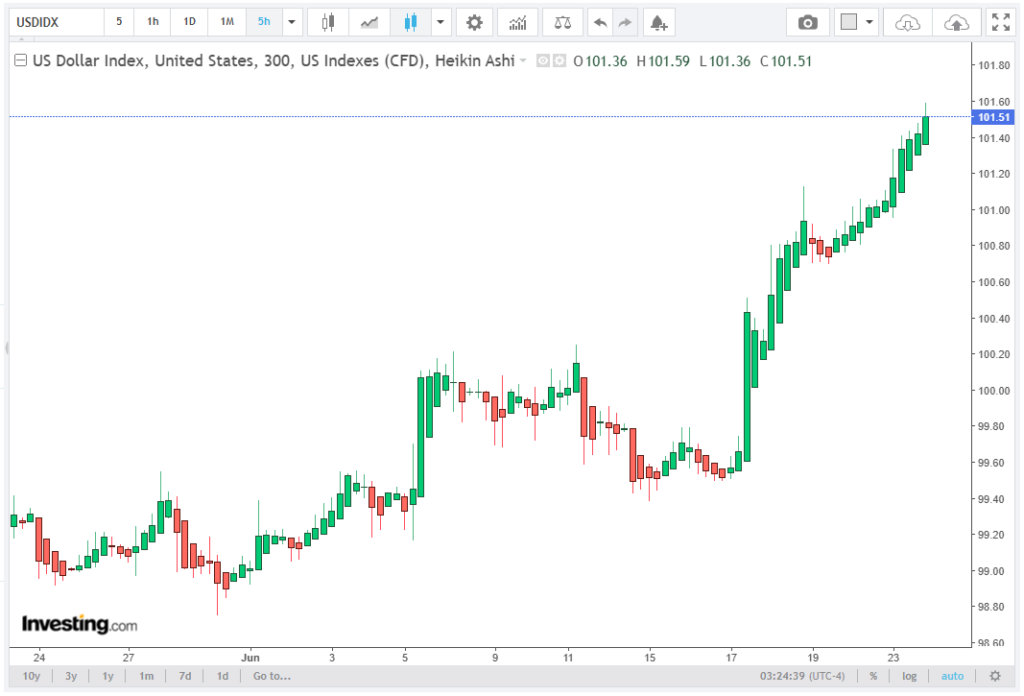
The US Dollar Index (DXY) continues to trade with firm bullish momentum around the 101.50 level, maintaining its position above key short-term equilibrium zones during Wednesday’s early European session.
Price action remains structurally supported as the index holds above the 101.00–101.20 intraday demand area, confirming that buyers continue to dominate near-term flow. In the following article, Rubinax’s brokers take a closer look at this topic.
The current advance extends a broader upward sequence that has lifted the index from the 100.00 psychological base region to above 101.50, representing a net appreciation of roughly 1.5%–2.0% across the latest impulsive leg. Importantly, this move is occurring with limited pullbacks, indicating a trend-efficient environment in which retracements remain shallow and are quickly absorbed.
Macro Backdrop: Rate Expectations Driving Dollar Demand
The dominant fundamental driver behind the ongoing strength in the US Dollar Index remains the rapid repricing of interest rate expectations. Futures markets continue to adjust aggressively, reflecting increased probability of tighter monetary conditions over the coming meetings.
Current pricing places the probability of a 25-basis-point rate increase in July at 36.3%, a sharp rise from 8.5% just one week earlier, while expectations for a move in September have climbed to approximately 70.3%, compared with 29.1% previously. This shift reflects a meaningful tightening in forward guidance assumptions embedded in market pricing.
As a result, US yield differentials have widened relative to major counterparts, reinforcing structural demand for the USD. The sensitivity of the DXY to rate expectations remains high, with even marginal repricing in futures markets producing intraday index swings in the 0.3%–0.8% range, particularly during liquidity-thin sessions.
Trend Analysis: Strong Extension Above Key Moving Averages
From a technical perspective, the US Dollar Index is in a clearly defined bullish trend continuation phase, with price trading well above major dynamic support levels. The index remains positioned above the 20-day simple moving average, the 100-day moving average at 98.95, and the broader mean reversion level around the 100.00 handle.
The separation between current price levels and the 100-day moving average exceeds approximately 2.5%, which is typically indicative of a strong momentum regime rather than a neutral or range-bound market structure. This divergence suggests that trend-following participation remains dominant, with limited evidence of distribution at current levels.
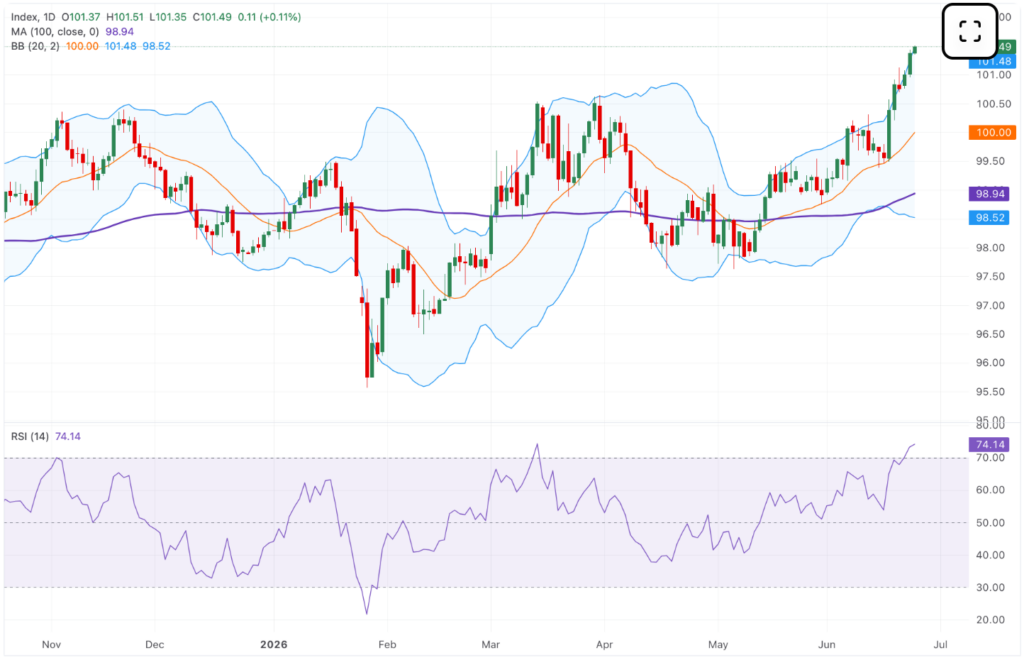
In addition, price is consistently trading above the Bollinger Bands midline, confirming that directional bias remains firmly tilted upward within a volatility expansion phase.
Volatility Framework: Bollinger Bands and Dynamic Support
The Bollinger Bands (20-period, 2 standard deviations) structure shows the DXY riding the upper volatility boundary, currently positioned near the 101.48–101.55 region. This area has transitioned into immediate dynamic support, reflecting repeated acceptance of higher price levels and continued momentum persistence.
Such upper-band interaction typically signals a trend-strength environment, where price walks the band during sustained directional moves. However, it also increases the probability of short-term mean reversion events once momentum temporarily exhausts.
Below current levels, the 20-day moving average near 100.00 remains the primary equilibrium anchor, while deeper support resides at the 100-day moving average at 98.95. The lower Bollinger Band around 98.52 represents the extreme downside volatility boundary, implying that a full corrective phase would require a decline of roughly 2.5%–3.0% from current levels.
Momentum Conditions: RSI Signals Overbought Pressure
The Relative Strength Index (RSI 14) is currently positioned near 74, placing it firmly within overbought territory. This reading confirms strong underlying momentum but also indicates that the current advance is becoming technically stretched.
In trending environments, RSI levels above 70 often persist for extended periods; however, they also tend to coincide with phases of reduced upside efficiency. This means that while the trend remains intact, the probability of short-term consolidation or corrective pullbacks increases materially at current levels.
Historically, RSI readings in the low-to-mid 70s within strong macro-driven trends often precede sideways consolidation rather than immediate trend reversal, especially when macro catalysts such as rate repricing continue to support directional bias.
Outlook: Strong Trend With Rising Exhaustion Risk
The US Dollar Index remains firmly positioned within a bullish macro-technical regime, supported by rising interest rate expectations, elevated yield differentials, and persistent trend-following momentum. Price structure continues to favor upside continuation as long as the index holds above the 100.00–100-day moving average zone.
However, the combination of RSI at 74, upper Bollinger Band interaction, and extended deviation from the 100-day mean suggests that the market is entering a phase of increasing technical exhaustion risk.
While the primary trend remains upward, conditions now favor potential short-term consolidation between 101.48 support and 101.95–102.00 resistance before any decisive breakout or corrective rotation.
Overall, the structure remains bullish, but the probability of intermittent pullbacks has increased as momentum indicators signal stretched conditions within an otherwise dominant upward trend.