
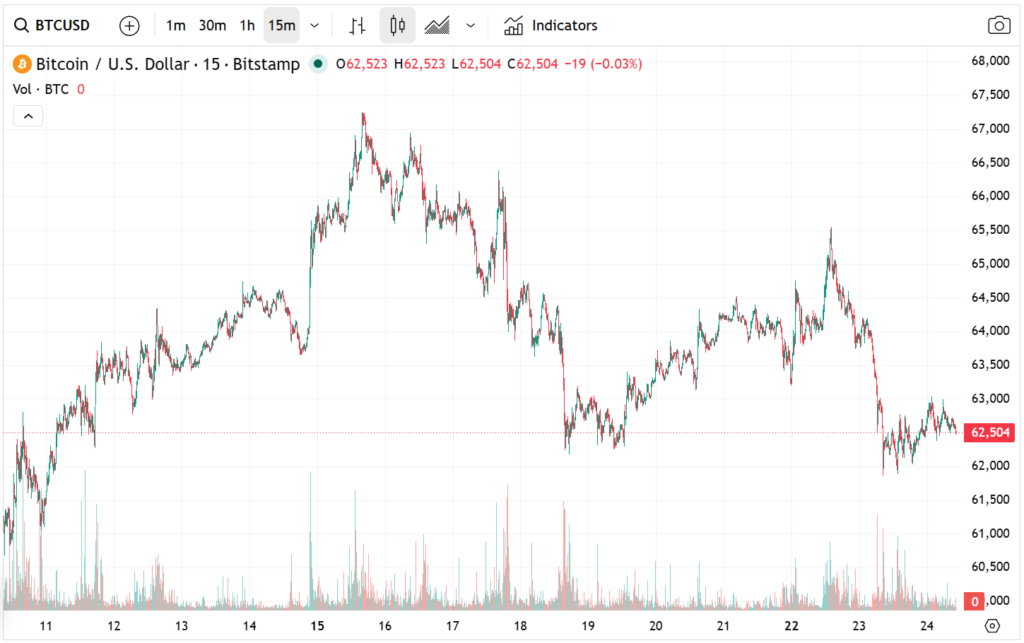
The Bitcoin BTC/USD pair is showing increasing signs of technical exhaustion, trading around 62,473 while remaining trapped in a narrow consolidation range. Despite brief intraday volatility, price action continues to hover just above the critical $60,000 support level, signaling a market in equilibrium but under pressure. This article features Vaulltier’s brokers delving deeply into this subject.
This current level is significantly lower than last month’s peak near 82,890, highlighting a substantial retracement phase driven by weakening risk appetite and deteriorating macro conditions. The structure suggests that Bitcoin is transitioning from a bullish expansion cycle into a corrective consolidation regime.
Bitcoin Price Retreats as Risk Appetite Weakens
The recent decline in BTC/USD is closely tied to a broader risk-off sentiment across global financial markets. Investors have been reducing exposure to speculative assets, including high-growth equities and digital assets.
Major US indices such as the Nasdaq 100 and the S&P 500 have both retreated, led by heavy selling in technology stocks. This synchronized downturn reflects a broader liquidity contraction and shifting investor positioning away from high-beta assets.
At the same time, the US Dollar Index (DXY) has surged to its highest level in over a year. This strengthening dollar environment is typically bearish for Bitcoin, as BTC is priced in USD and tends to move inversely to dollar liquidity trends.
Federal Reserve Policy and Macro Pressure
Macroeconomic conditions are adding to bearish pressure on BTC/USD. The Federal Reserve has signaled that further rate hikes may still be possible, despite earlier expectations of policy easing.
Higher rates increase the appeal of yield-bearing assets, reducing demand for non-yielding assets like Bitcoin. BTC has historically underperformed in tight monetary cycles, particularly when liquidity conditions are restrictive.
Markets are now focused on upcoming inflation data, especially the US PCE report. If inflation rises again, it could reinforce expectations of prolonged tightening and add further pressure on BTC/USD.
ETF Outflows Signal Weak Institutional Demand
Another key bearish driver is sustained outflows from spot Bitcoin ETFs. Recent data shows institutional products have lost over $2.3 billion in assets this week alone, following a further $2.4 billion decline in the previous month.
This reflects reduced institutional accumulation, which has historically supported Bitcoin’s bullish cycles. The ongoing withdrawals suggest capital may be rotating toward traditional equities, particularly US tech stocks, which continue to deliver strong returns.
The combination of ETF outflows and stronger equities creates a dual headwind for BTC/USD, weighing on both demand and sentiment.
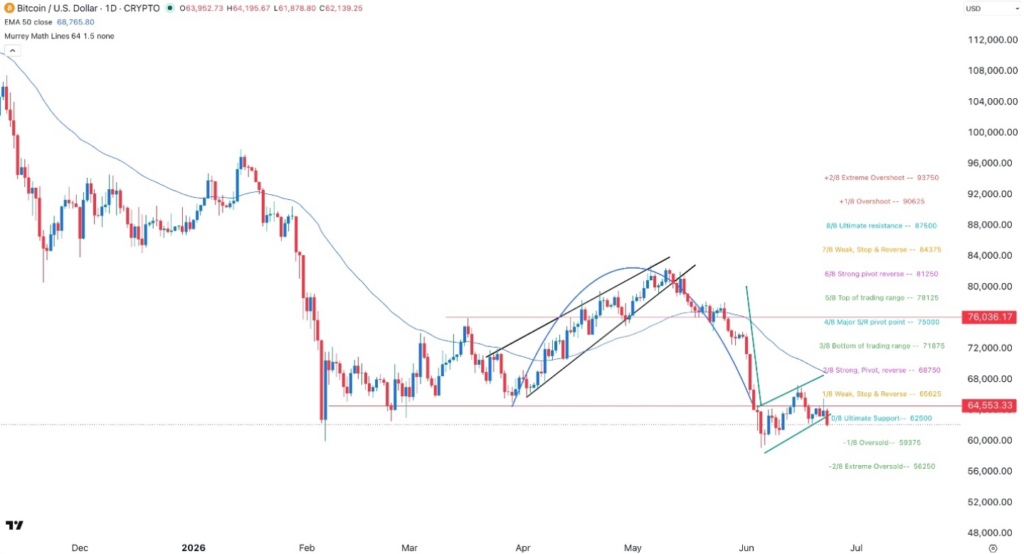
Technical Analysis: Bearish Flag Formation Intensifies Downside Risk
From a technical perspective, the BTC/USD chart is exhibiting a textbook bearish flag pattern, a continuation structure that typically follows a sharp downward impulse.
After the initial decline, Bitcoin has entered a tight consolidation channel, but importantly, price action is now drifting toward the lower boundary of the flag, increasing the probability of a breakdown.
The pair has also fallen below the 50-day Exponential Moving Average (EMA), a key medium-term trend indicator. This breakdown confirms a shift from bullish momentum to bearish control, as buyers fail to defend dynamic support levels.
Ichimoku Cloud and Momentum Indicators Confirm Weakness
Further technical deterioration is visible in the Ichimoku Cloud, with BTC/USD breaking decisively below the cloud structure. Since the cloud represents a trend equilibrium zone, trading beneath it signals sustained bearish momentum.
The Relative Strength Index (RSI) is also trending lower, indicating fading buying pressure. While not yet in oversold territory, the downward slope suggests ongoing distribution rather than accumulation.
Together, these indicators reinforce a broader picture of structural weakness across multiple timeframes.
Key Support and Downside Targets
The most important immediate level for BTC/USD remains the $60,000 psychological support zone. A sustained break below this threshold would likely trigger accelerated selling, as stop-loss clusters and algorithmic triggers are activated.
If bearish momentum continues, the next major downside target is projected around 58,000, where historical liquidity zones and prior consolidation levels may provide temporary support.
However, a breakdown of the bearish flag would also open the door to a deeper retracement phase, especially if macro conditions deteriorate further or ETF outflows persist.
Outlook: Bearish Continuation Favored
The overall outlook for BTC/USD remains bearish in the near term, driven by a convergence of technical breakdowns, macro tightening expectations, and institutional outflows.
The combination of a confirmed bearish flag pattern, price trading below the 50-day EMA, and weakness in momentum indicators suggests that sellers currently maintain control of the market structure.
Unless Bitcoin can reclaim the $60,000–$62,000 resistance zone with strong volume, the probability of a continuation move toward 58,000 and lower remains elevated.
In summary, BTC/USD is entering a critical phase where both macroeconomic pressure and technical confirmation align, reinforcing the risk of a deeper bearish continuation trend in the short to medium term.