
The analysts at Risance review the Nasdaq 100, which has bounced back from last week’s sharp sell-off in technology stocks and now trades around 28,200 points. The recovery looks promising, but the market must prove that buyers can protect it, and a few price zones will decide whether this rebound has a future.
A Rebound After The Technology Rout
The worst day of the decline came on November 5, when tech shares were hit hard. Fears about the cost of building artificial intelligence systems, lofty valuations and the financing needs of AI infrastructure left investors very reactive to any slip in giants such as Nvidia.
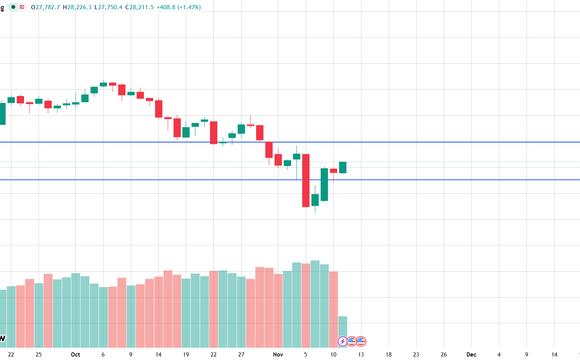
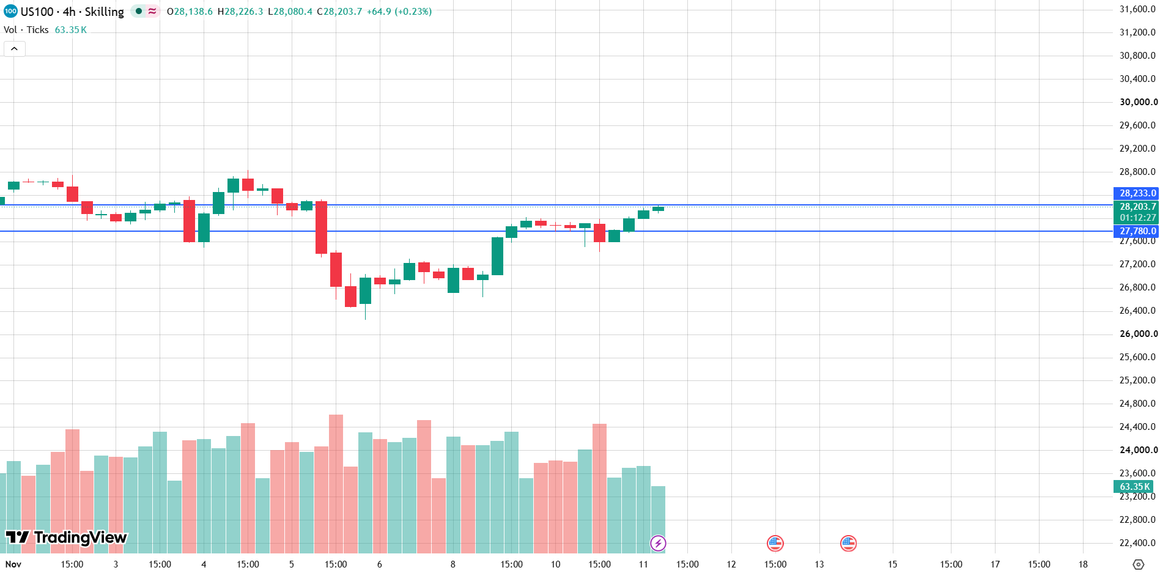
On November 6, index futures dropped to about 26,366. Since then, the market has regained a large part of the loss. A second push lower on November 10 reached 27,516 but did not turn into a lasting breakdown, and prices climbed again overnight to a peak near 28,233. These figures come from futures trading, so quotes on other platforms may differ slightly.
AI Sentiment Starts To Improve
Outside the United States, technology stocks have been recovering too. South Korea’s KOSDAQ index gained almost 5%, a sign that investors are willing to buy AI-linked companies again.
At home, CoreWeave, which rents out computing power for AI, rose about 13% after reporting fast sales growth and a higher outlook. Strong demand for AI hardware and services is clear, yet it does not remove doubts about financing costs, so optimism and caution can exist side by side.
Inflation Remains A Risk
The economic backdrop is less friendly. Consumer prices in the United States rose 0.4% in October from the previous month, and the core measure gained 0.3%. Such numbers keep alive the chance of higher interest rates, a danger for growth stocks, whose future profits lose value when borrowing becomes more expensive.
What Buying Pressure Shows
Beneath the price, the picture has also improved. During the rebound, hourly advances were backed by increasingly steady buying activity. On the morning of November 10, the index even climbed about 362 points in one hour despite a majority of aggressive sell orders, which means that sellers were struggling to push it down.
This is not proof that large institutions are accumulating, and it is no promise of another rally. It only shows that the market no longer reacts to selling the way it did last week.
The Key Zone Between 27,780 And 27,813
The most useful area on the chart sits between 27,780 and 27,813. The first number is the price where the most trading happened during the previous session, and the second is the average price of that session, calculated with trading volume. With the two so close together, they mark a region of strong interest.
If the index remains comfortably above it, the rebound keeps real support. If it spends a long time beneath it, traders will doubt that buyers are in charge.
A quick dip that reverses is very different from a drop that holds, so the time spent below matters as much as the depth. A wider cushion lies near 27,600, just under the previous day’s value area, but using it means accepting a larger loss if the bullish idea fails.
What Could Happen Next
If the index settles above 28,233 to 28,250, the next references are 28,465 and the November 4 high near 28,969. If sellers take over, a fall under 28,060 would be an early alarm, and a drop beneath 27,600 would suggest deeper trouble, leaving the 27,516 low as the next target. A third option is a quiet range, which would only show that investors have not yet chosen a direction.
Support And Resistance Levels
On the upside, the first resistance is the 28,233 to 28,250 area, followed by 28,465 and 28,969. A close above the last level would suggest that the whole sell-off has been erased.
On the downside, the first support is 28,060 to 28,100, then the 27,780 to 27,813 zone. Below it, 27,600 and 27,516 are the levels to watch.
What Traders Can Do
A bullish view does not mean that buying at any price is wise. After a rise like this, entering near the highs exposes traders to a pullback, especially with leverage. A patient plan involves waiting for a retest of 27,780 to 27,813, or for a firm close over 28,250, and then aim for 28,465 with a stop-loss beneath the support zone.
Sellers may wait for sustained trading under 27,780, with 27,516 as the target. Position size should stay modest, since the index can move several hundred points in a day, and staying out is also a valid choice when the risk is not clear.
Conclusion
The Nasdaq 100 is recovering from a sharp technology sell-off, helped by improving appetite for AI and stronger buying activity, while inflation remains a risk. The 28,250 resistance and the 27,780 support are the levels to follow.
Traders following Indices strategies should watch technology stocks, inflation data and the reaction at these levels, since these factors are likely to guide the next move in the index.