
Gold prices rallied sharply into the second week of November, reclaiming the $4,100 level after a punishing sell-off that drove the metal below $3,900 earlier in the month.
The rebound, fuelled by a softer US dollar and declining Treasury yields, has reignited debate over whether the yellow metal can sustain its recovery or whether resistance overhead will cap further gains.
Analysts from Sylverix note that the post-midterm political landscape has injected fresh uncertainty into rate expectations, creating a supportive backdrop for safe-haven assets.
With the Federal Reserve’s benchmark rate holding at 4.00% and market pricing in a 79% probability of a hike at the December meeting, gold finds itself caught between competing macro forces.
The metal’s all-time high of $5,608.35, reached in January 2026, remains a distant target, but the structural bull case has not been dismantled.
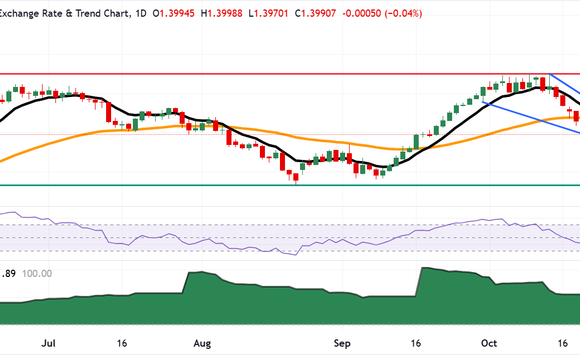
Technical Landscape Points to a Pivotal Range
On the daily chart, XAU/USD has established a near-term trading range between $4,028 support and $4,156 resistance.
Momentum indicators present a mixed picture. The Relative Strength Index (RSI) on the daily timeframe has flatlined around 46.48, reflecting neither overbought nor oversold conditions.
The MACD continues to print red histogram bars, suggesting that bearish momentum has not fully dissipated despite the bounce from the lows. The Average Directional Index (ADX) remains neutral, indicating that the current move lacks the conviction needed for a sustained directional trend.
The $4,040 zone has emerged as critical support, aligning with the 61.8% Fibonacci retracement of the early November rally and the November 14 session low. This Fibonacci level is a common target for corrections and has attracted buyers on multiple occasions during the past fortnight.
A sustained break below this level would expose the $4,000 psychological floor, which has acted as a major demand zone throughout late October and early November.
Macro Crosswinds Shape the Outlook
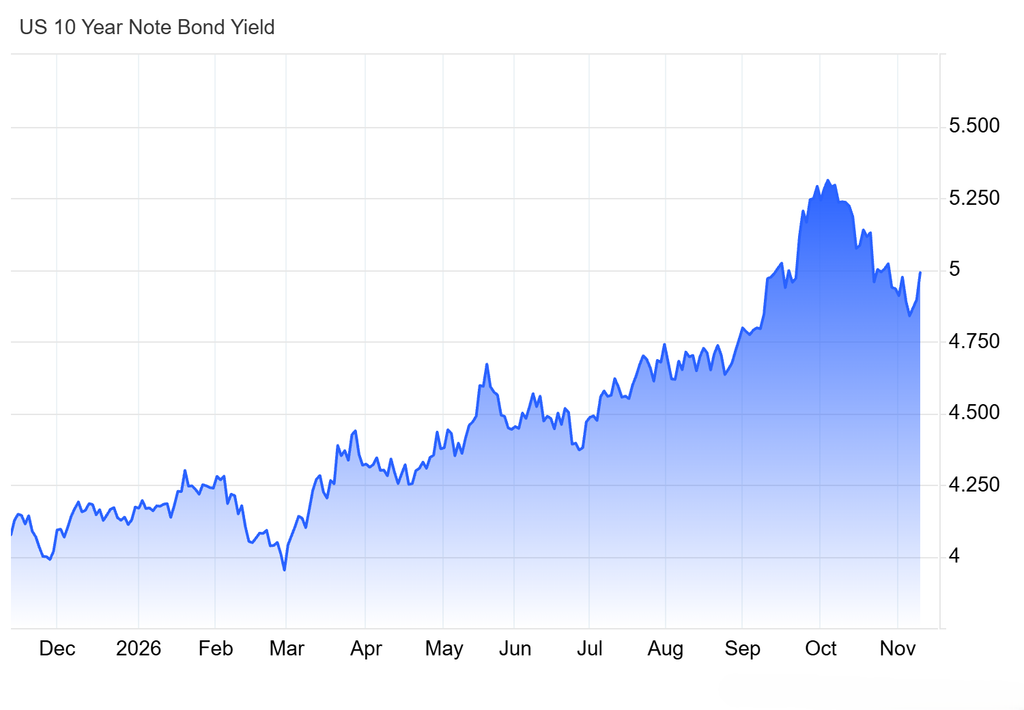
The fundamental backdrop for gold remains complex. Lower Treasury yields have offered meaningful support, with the US 10-year yield declining 6.6 basis points to 4.883%, its lowest reading since early September.
A weaker dollar index has further boosted the metal’s appeal for holders of other currencies, as gold becomes cheaper in euro, yen, and sterling terms.
Central bank demand continues to underpin the broader bull case. According to World Gold Council data, official sector purchases reached 694 tonnes in the first three quarters of 2026, on pace to match the record levels seen in recent years.
This structural bid from sovereign wealth funds and central banks has provided a floor beneath prices even during periods of aggressive selling by speculative accounts and ETF holders.
Goldman Sachs recently revised its gold price forecast to $4,150 for year-end 2026 and $4,800 for 2027, citing hawkish Federal Reserve policy as a near-term headwind but persistent central bank accumulation as a long-term tailwind.
The bank noted that any dovish pivot from the Fed could rapidly accelerate price appreciation toward the January highs.
Trade policy developments have added another layer of complexity. A suspension of shipping countermeasures and partial tariff relief between Washington and Beijing, announced ahead of the APEC summit, has eased some geopolitical risk premiums.
However, the temporary nature of these concessions means that trade tensions could reignite at short notice, providing a potential catalyst for renewed safe-haven demand.
What Traders Should Watch Next
The coming sessions will test whether gold can reclaim and hold the $4,124 level, which represents the 100-day SMA. A clean break above this barrier opens the path toward the November 11 high at $4,170 and subsequently the $4,210 to $4,250 resistance cluster formed during the prior week’s highs.
On the downside, a failure to hold $4,040 support would shift the technical bias decisively bearish, targeting the $4,000 to $3,990 zone. Below that, the 2026 low near $3,891 becomes the next significant demand area where longer-term buyers would likely step in.
Key catalysts on the calendar include the next round of US inflation data and any forward guidance from Federal Reserve officials on the trajectory of monetary policy.
The scheduled trilateral talks between the US, Ukraine, and Russia in Abu Dhabi in November represent another potential source of volatility, as any progress or breakdown in negotiations could shift safe-haven flows significantly.
Gold remains at a crossroads. The broader structural case, built on central bank accumulation and fiscal uncertainty, supports higher prices over the medium term.
The short-term picture, however, hinges on whether the recovery from the November lows can build sufficient momentum to challenge overhead resistance.
Until the 100-day moving average is convincingly reclaimed, rallies are likely to meet selling pressure, keeping the metal range-bound between $4,000 and $4,170.