
Bitcoin has surrendered roughly 9% from its post-midterm election spike near $81,000, sliding into the mid-$74,000s as selling pressure intensified across cryptocurrency markets.
The decline marks the fifth consecutive weekly drop for the world’s largest digital asset, erasing the brief optimism that followed the US midterm results and raising questions about the durability of the broader crypto rally.
Sylverix observes that the technical damage left behind now reads as a regime change, with momentum decisively shifting from buyers to sellers.
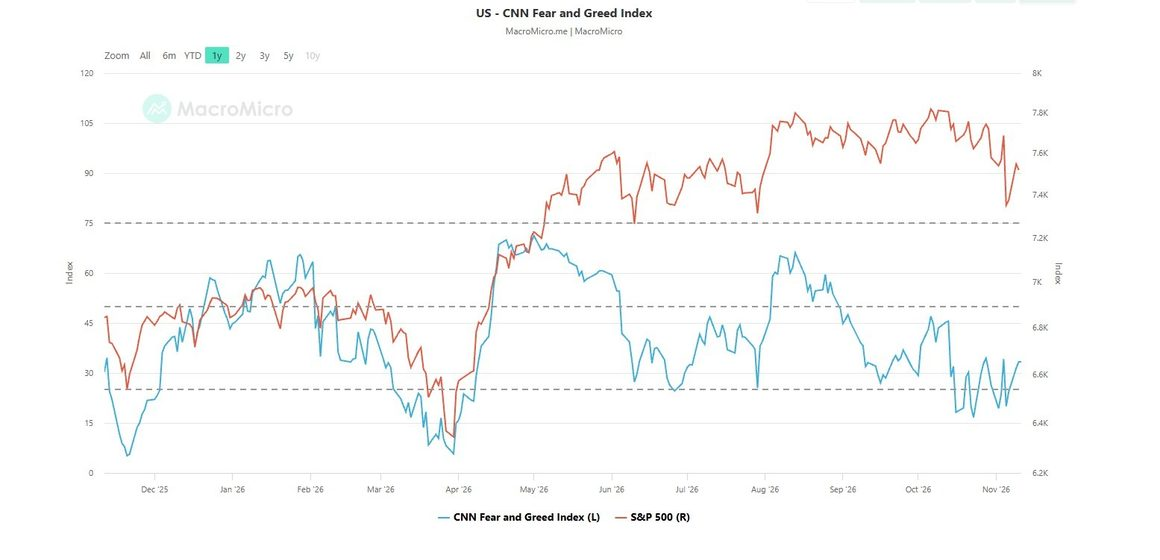
The Fear and Greed Index has dropped to 29, classified as Fear, reflecting a sharp deterioration in sentiment since the initial post-election rally. On November 9, BTC traded near $74,445 on major exchanges, attempting a tepid rebound against a firmly bearish daily backdrop.
Moving Averages Flash a Full Sell Configuration
The technical picture has deteriorated rapidly. All major moving averages now sit above the market price, forming a bearish alignment that has not been seen since the previous major correction.
The 10-day EMA at $76,452, the 20-day EMA at $77,991, the 50-day at $79,187, the 100-day at $77,539, and the 200-day at $76,435 all stand as overhead resistance, creating a layered ceiling that bulls must overcome to regain control.
The daily RSI has printed 34.01, its lowest reading since the prior correction, while the Stochastic RSI sits at just 11.18.
The aggregate technical scorecard counts 14 sell indications against only 3 buy signals; filtered to moving averages alone, the reading shows 13 sell versus 1 buy, a full Strong Sell configuration that typically precedes either a continuation lower or a sharp short-covering reversal.
Key support rests at $74,740, with a more significant demand zone at $73,500. On the upside, the 100-day moving average near $76,950 represents the first barrier that bulls must reclaim to shift momentum.
The $82,000 level remains the ceiling that would need to be cleared to reverse the current bearish structure entirely. Between current levels and that target sits a dense cluster of resistance formed by the converging moving averages.
Broader Crypto Market Reels from Multiple Headwinds
The sell-off extends well beyond Bitcoin. Ethereum dropped 5.7% in 24 hours to approximately $2,098, and the total cryptocurrency market capitalisation shed roughly $120 billion during the November 5 session alone.
Altcoins have fared worse, with several large-cap tokens declining by double digits as risk appetite evaporated across the digital asset spectrum.
Several catalysts have converged to drive the downturn. ETF outflows have accelerated sharply, reversing the inflow trend that characterised the third quarter and signalling a shift in institutional positioning.
Persistent uncertainty surrounding Federal Reserve policy, with markets pricing a possible rate hike rather than the cuts anticipated earlier in the year, has drained liquidity from risk assets. Concerns about exchange security resurfaced following reports of platform vulnerabilities, further eroding confidence among retail participants.
Bitcoin posted its second consecutive losing month in October, falling 7.3%, defying seasonal patterns that have historically made the fourth quarter a period of strength for the asset class.
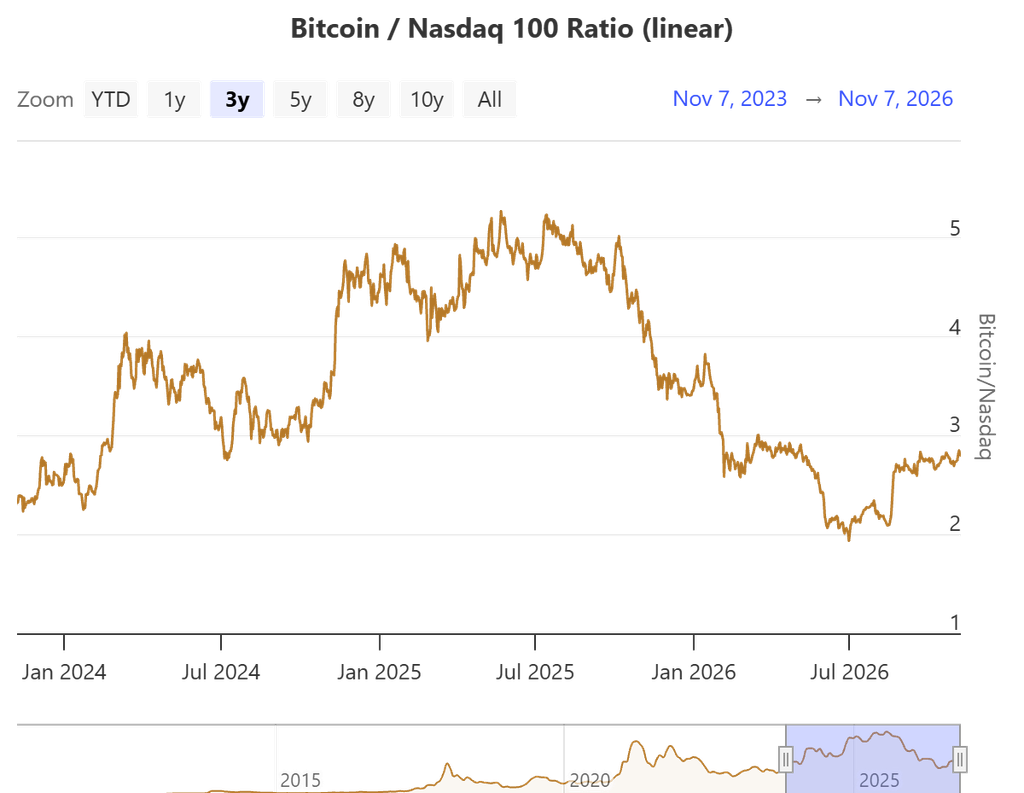
The digital asset’s 30-day rolling correlation with the Nasdaq Composite has risen above 0.75, its highest reading this year, suggesting that macro-driven portfolio de-risking rather than crypto-specific catalysts is the dominant force behind the decline.
Can Seasonal Strength Rescue the Bulls?
Despite the bearish technical structure, historical data offers a potential contrarian argument. November has traditionally been Bitcoin’s strongest month, delivering an average return of 42% across its trading history.
Prominent investment voices have taken the longer view. Ark Invest’s Cathie Wood has drawn a parallel between Bitcoin’s current trajectory and gold’s multi-decade appreciation cycle, arguing that the digital asset remains significantly undervalued relative to its eventual adoption curve.
However, such long-term frameworks offer limited guidance for near-term positioning when technical indicators are aligned against the prevailing trend.
For the week ahead, traders should monitor the $73,500 support level closely. A break below this zone would open the path toward $72,000, the minimum price band identified by several on-chain analytics models as a potential capitulation target.
On the upside, a reclaim of $76,950 on a closing basis would suggest the worst of the selling pressure has passed, potentially triggering a short-covering rally toward the $80,000 psychological level.
Bitcoin’s price action in the coming days will likely hinge on the interplay between deteriorating technicals and seasonal tailwinds. With sentiment firmly in the fear zone and leveraged positions concentrated on the short side, any catalyst for a reversal could produce a sharp squeeze higher.
Absent such a catalyst, however, the path of least resistance points lower, and the $74,000 level looks increasingly fragile.