
Gold prices continued recovering on Wednesday after breaking above an important technical resistance zone, improving the outlook for further gains despite persistent macroeconomic uncertainty. The precious metal has attracted renewed buying interest following its rebound from recent lows, with traders now watching whether the latest breakout can develop into a broader bullish reversal.
Experts at Lucovox examine the latest gold market developments, highlighting how technical breakout signals, moving averages, and key resistance levels may influence price action over the coming sessions.
Gold Recovery Builds Momentum
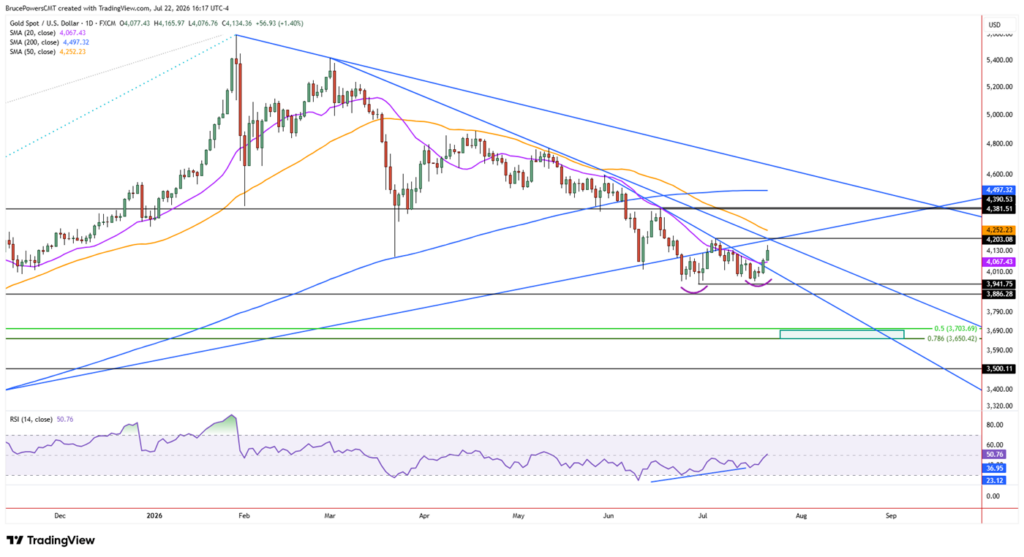
Gold advanced toward $4,166, extending the rebound that began earlier in the week. The latest rally confirmed a breakout above both a descending trendline and the 20-day moving average, two technical signals that suggest selling pressure is beginning to weaken.
Although the recent advance has improved short-term sentiment, traders remain focused on whether buyers can maintain control above the newly reclaimed support zone. Holding these levels would strengthen confidence that the latest recovery represents more than just a temporary bounce within the broader correction.
The $4,203 Level Remains the Key Test
Despite the encouraging breakout, several important technical barriers remain overhead.
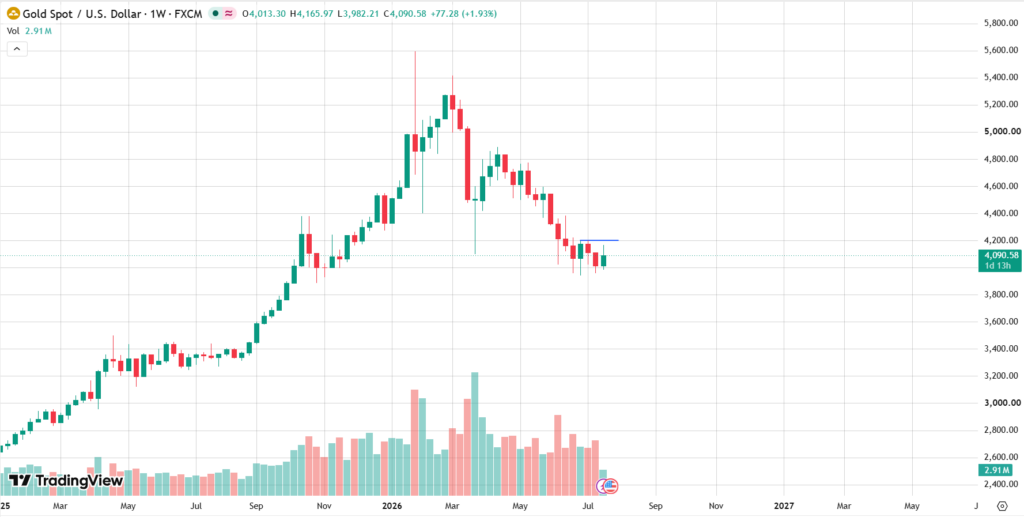
The first major obstacle sits near $4,203, which marks the recent swing high. A decisive move above this level would complete a bullish double-bottom formation while confirming that buyers have regained greater control of market momentum.
This area also coincides with multiple technical resistance factors, making it one of the most closely watched price zones in the current market structure. A successful breakout would likely attract additional buying interest from momentum traders and technical investors.
Moving Averages Continue to Shape the Outlook
While recent price action has turned more constructive, moving averages continue to define the broader technical landscape.
The declining 50-day moving average, currently near $4,252, remains an important dynamic resistance level. At the same time, several descending trendlines converge in roughly the same price region, creating a significant resistance cluster.
Because multiple technical signals overlap, a sustained move above both $4,203 and the 50-day moving average would represent a much stronger confirmation that the recent recovery is evolving into a genuine trend reversal rather than another temporary rally.
Until then, traders are likely to remain cautious, waiting for additional confirmation before increasing bullish exposure.
Market Drivers Extend Beyond Technical Signals
Although technical analysis currently dominates the short-term outlook, broader macroeconomic developments remain equally important.
Investors continue monitoring inflation expectations, Treasury yields, and geopolitical developments, all of which directly influence demand for safe-haven assets such as gold. Normally, higher government bond yields reduce the attractiveness of non-yielding assets. However, recent sessions have demonstrated that strong physical demand and safe-haven buying can offset part of that pressure.
Central bank purchases also remain an important long-term pillar supporting the precious metals market. Continued reserve diversification by several monetary authorities has helped maintain underlying demand even during periods of elevated real interest rates.
In addition, traders are increasingly focusing on upcoming economic releases and central bank communication, which could influence expectations regarding future monetary policy. Any signs that inflation remains persistent may continue supporting defensive assets while also increasing market volatility across currencies, bonds, and commodities.
Higher Resistance Levels Come Into Focus
Should buyers successfully clear the current resistance zone, attention would quickly shift toward higher technical objectives.
The previous major high near $4,382 represents the first significant upside target. Beyond that, the 200-day moving average, located near $4,497, could become the next major area of resistance.
Historically, long-term moving averages often change their role after major trend shifts. Since the 200-day average previously acted as strong support during the broader uptrend, it may now initially function as resistance before allowing any sustained continuation higher.
On the downside, maintaining support above the breakout zone remains equally important. A failure to hold above recently reclaimed technical levels would weaken the bullish scenario and increase the probability of renewed consolidation before another breakout attempt.
Conclusion
Gold has improved its technical outlook after breaking above a key descending trendline and reclaiming short-term momentum. Nevertheless, the market still faces several important resistance levels before a broader bullish reversal can be fully confirmed.
According to the latest analysis from ML Gold, the $4,203 resistance area and the declining 50-day moving average remain the most important technical hurdles. A decisive break above both levels would significantly strengthen the bullish outlook and potentially open the path toward $4,382 and eventually the 200-day moving average near $4,497. Until then, traders are likely to balance improving technical conditions with ongoing macroeconomic uncertainty and evolving market sentiment.