
The AUD/USD pair advances approximately 0.5% toward 0.6980 during European trading, recovering from recent weakness as the Australian Dollar (AUD) outperforms its major peers.
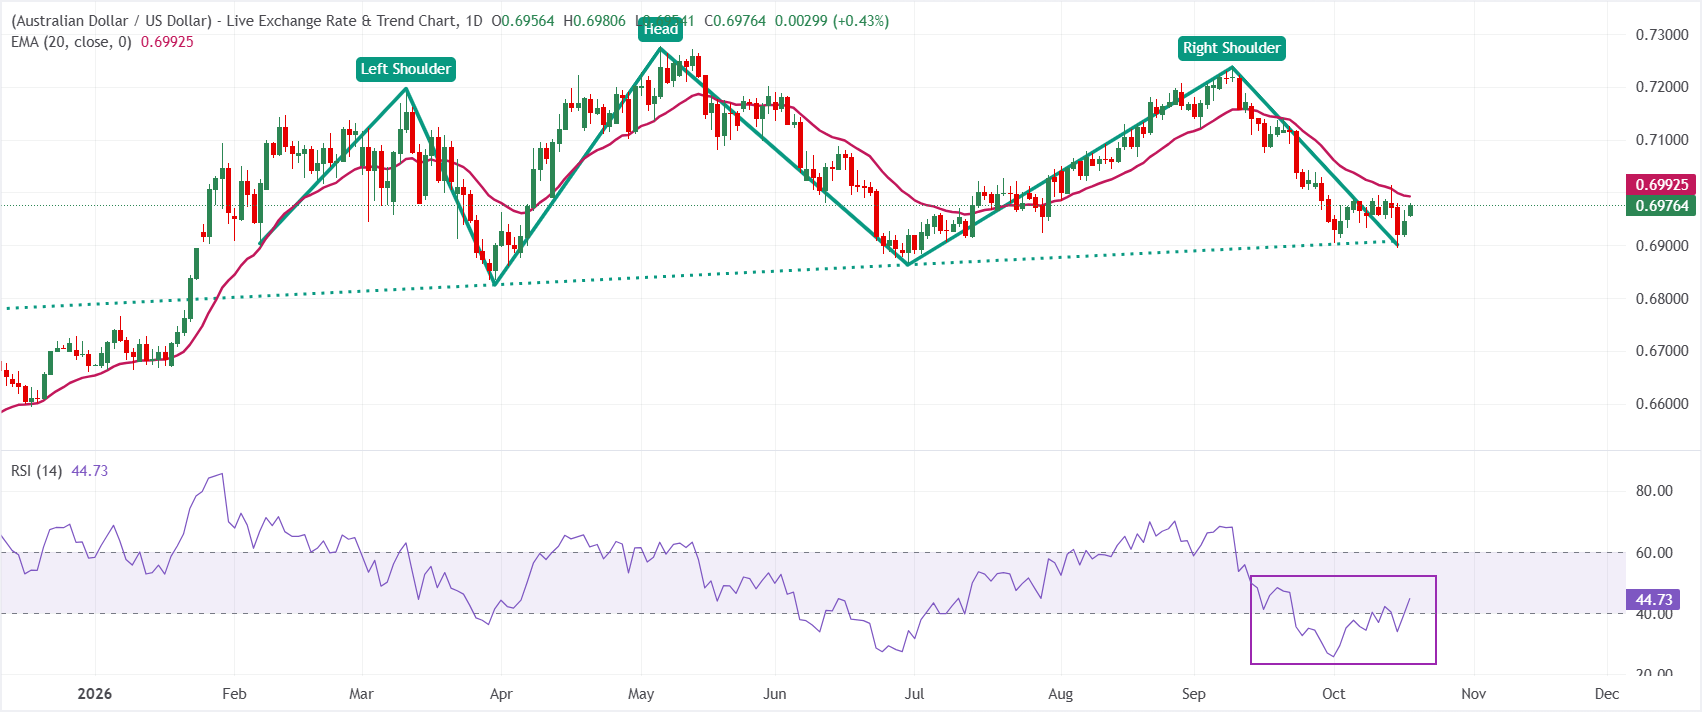
Despite the rebound, the pair’s short-term technical structure remains bearish, with price action constrained below the 20-day Exponential Moving Average (EMA) at 0.6993.
The article breaks down the topic with insights from Fonndure’s brokers.
The latest recovery follows a test of the 0.6900 neckline of a developing Head and Shoulders (H&S) formation, a pattern commonly associated with a potential bearish reversal. The reaction from this region suggests that buyers are defending a technically significant support zone, although the rebound has yet to generate a confirmed bullish signal.
From a price-action perspective, the 0.6900–0.7000 range represents a critical decision area. A sustained move above 0.6993 would weaken immediate selling pressure, while a decisive daily close below 0.6900 would strengthen the bearish scenario.
RBA Rate Expectations and Australian Employment Data
The Australian Dollar’s advance comes amid uncertainty surrounding the Reserve Bank of Australia’s (RBA) monetary policy trajectory. The central bank has implemented four 25-basis-point rate hikes during 2026, raising the Official Cash Rate (OCR) to 4.60%.
Recent labour-market data have weakened expectations for additional tightening. Australia’s unemployment rate increased to 4.6%, while employment declined by approximately 40,000 positions, reversing the gains recorded in July. These figures suggest that restrictive monetary conditions may be weighing on labour demand.
Market pricing reflects this shift, with the RBA Rate Tracker indicating an approximately 82% probability of an unchanged OCR at the November meeting. Reduced expectations for another rate increase could limit the Australian Dollar’s fundamental upside, particularly if incoming inflation and employment indicators reinforce the case for a policy pause.
For AUD/USD, the divergence between relatively high Australian interest rates and declining expectations for further tightening remains important. The currency may retain some yield support, although a sustained appreciation would likely require either stronger domestic data or additional weakness in the US Dollar.
US Dollar Weakness Provides External Support
The US Dollar (USD) trades broadly flat after experiencing significant selling pressure during the previous week. The decline followed a correction in US artificial intelligence-related equities, which had previously benefited from strong investor demand and elevated growth expectations.
Weakness in technology stocks contributed to shifts in market positioning, supporting a recovery in AUD/USD. The extent to which this tailwind persists will depend on broader risk sentiment and expectations for US monetary policy.
A continuation of US Dollar weakness could allow AUD/USD to challenge the 0.7000 psychological threshold. Renewed dollar demand, particularly amid deteriorating global risk appetite, could instead expose the pair to another test of the 0.6900 support zone.
AUD/USD Technical Analysis: H&S Neckline at 0.6900
On the daily chart, AUD/USD trades near 0.6976, below the 20-day EMA at 0.6993. The moving average acts as immediate dynamic resistance, indicating that the pair has yet to establish a sustainable recovery following its recent decline.
The Relative Strength Index (RSI) at 44 remains below the neutral 50 level, signalling that bearish momentum retains a modest advantage. The indicator is not in conventional oversold territory, leaving room for additional downside before selling pressure becomes technically stretched.
The primary chart feature is the Head and Shoulders formation, with its neckline positioned around 0.6900. This level represents the principal support threshold for the current technical structure.
A daily close below 0.6900 would confirm a downside break of neckline support and strengthen the probability of bearish continuation. The next downside objective could be estimated using the pattern’s measured-move technique, which subtracts the vertical distance between the head and neckline from the neckline breakout level.
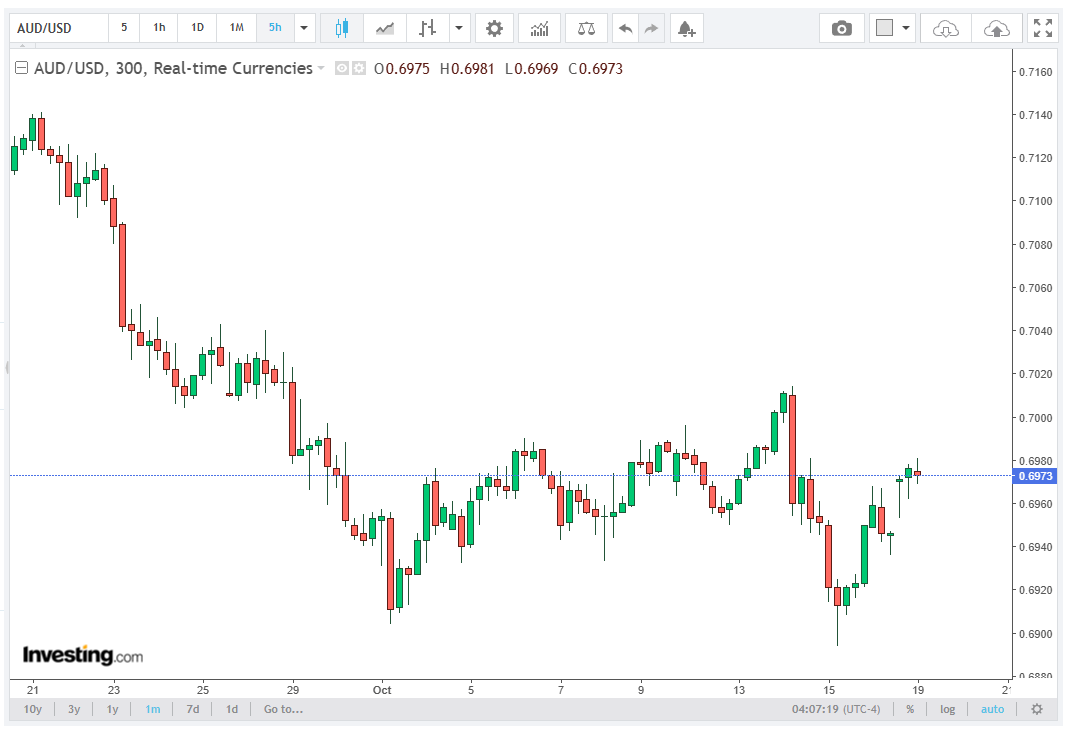
On the upside, the first technical hurdle stands at 0.6993, followed by the 0.7000 psychological level. A daily close above both thresholds would indicate improving short-term momentum and weaken the immediate bearish configuration.
Sustained acceptance above resistance would provide stronger evidence of a developing recovery than an intraday spike alone.
AUD/USD Price Forecast and Conclusion
The AUD/USD outlook remains cautiously bearish while the pair trades below 0.6993 and the RSI remains beneath 50. The immediate trading range is defined by 0.6900 support and 0.6993–0.7000 resistance.
A confirmed neckline breakdown would activate the bearish H&S scenario, with subsequent downside objectives dependent on the pattern’s measured height. A sustained breakout above the moving average and psychological resistance would instead signal a potential recovery in momentum.
Fundamentally, the Australian Dollar faces conflicting influences from a 4.60% OCR, weaker employment data, and reduced expectations for further RBA tightening, while US Dollar fluctuations provide an additional catalyst. The decisive technical signal will be whether buyers can reclaim 0.6993 or sellers force a confirmed break beneath 0.6900.