
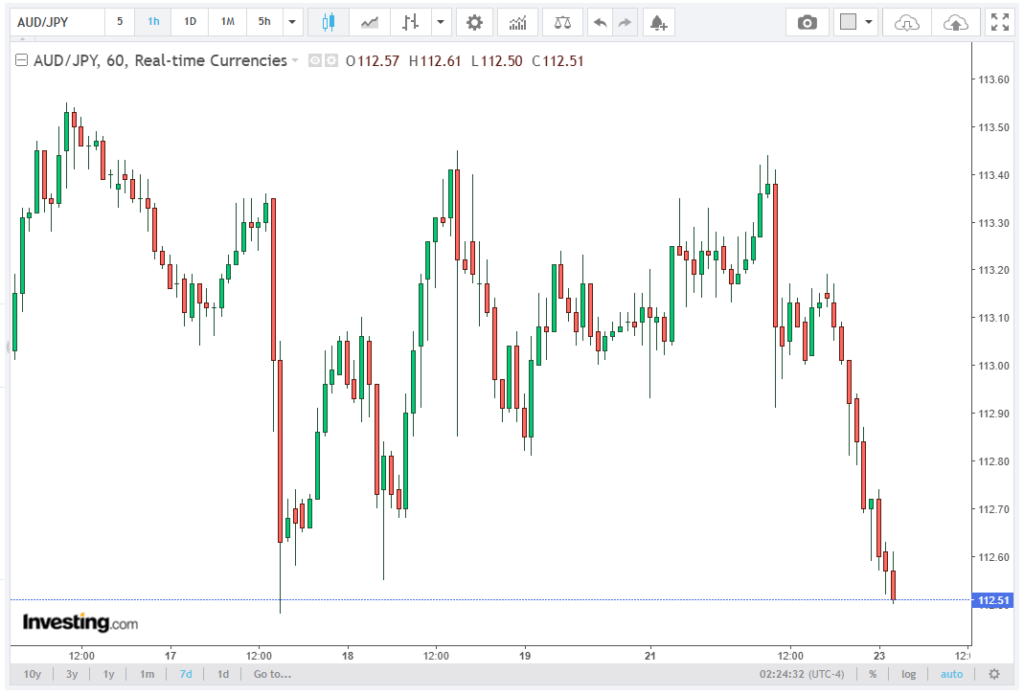
The AUD/JPY cross is trading around 112.75, remaining in negative territory during early Tuesday European hours after repeated failures to sustain levels above 113.00. The intraday structure reflects a controlled corrective pullback rather than a trend reversal, with price still operating inside a medium-term bullish consolidation channel.
This article offers a detailed exploration of the topic, led by Findtech Group’s team of expert brokers.
Selling pressure has been concentrated near 112.70–112.90, where liquidity pockets have repeatedly capped intraday rebounds. Despite this weakness, downside momentum remains limited, indicating that the market is still balancing between yen-driven intervention risk flows and Australian yield support dynamics.
Price Structure: Compression Below 113.00 Resistance Band
From a microstructure perspective, AUD/JPY is compressing beneath a clearly defined 113.00–113.40 resistance zone. This area represents a confluence of short-term supply, Bollinger mid-band resistance, and previous distribution highs.
Repeated rejections from this zone indicate that the market is in a volatility contraction phase, where upside momentum is being absorbed by systematic selling and short-term profit taking.
Intraday volatility has narrowed to approximately 0.35–0.45 JPY, suggesting decreasing directional conviction and increasing probability of range continuation between 112.20 and 113.40.
Technical Structure: Bollinger and SMA Framework
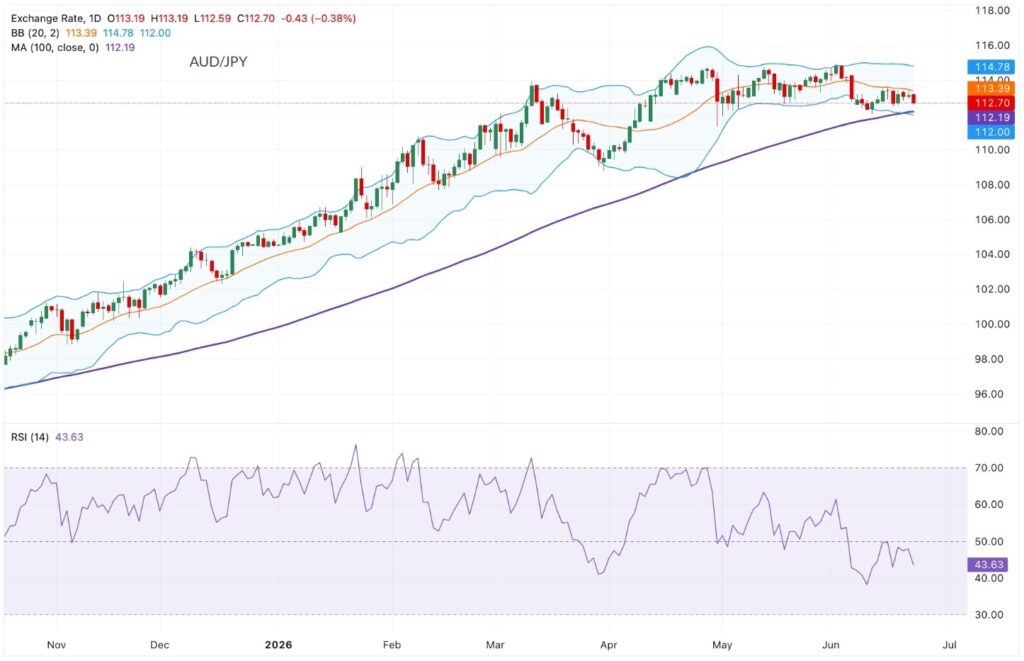
On the daily timeframe, AUD/JPY remains technically constructive as long as price holds above the 100-day Simple Moving Average (SMA) at approximately 112.20.
This moving average continues to act as a dynamic structural floor, reinforcing the broader bullish trend classification despite recent retracement.
Price is currently oscillating within the upper half of the Bollinger Band envelope, which spans roughly from 112.00 to 114.78. The inability to expand toward the upper band reflects waning upside momentum, not trend failure.
The Bollinger middle band at 113.40 remains the key pivot. Sustained rejection below this level confirms ongoing mean-reversion pressure, while a clean break above it would signal a return of trend expansion conditions.
Momentum Analysis: RSI Signals Neutral-Bearish Drift
The Relative Strength Index (RSI) is currently positioned at 43.6, reflecting a mild bearish tilt within a neutral regime. This reading is below the 50 equilibrium level but well above the 30 oversold threshold, indicating that the market is correcting rather than reversing.
Historically, RSI values between 40 and 45 in AUD/JPY trend environments tend to correspond with consolidation phases inside broader uptrends, especially when price remains above the 100-day SMA.
Momentum compression is consistent with current price behavior, suggesting that volatility is being stored for a potential breakout once macro catalysts reassert directional pressure.
Key Resistance Cluster: 113.40 to 114.80 Expansion Zone
Immediate resistance is located at 113.40, which aligns precisely with the Bollinger mid-band and acts as the primary short-term trigger level.
A sustained break above 113.40 would shift intraday structure from consolidation to bullish continuation, opening a pathway toward 114.20, followed by the upper Bollinger boundary at approximately 114.78.
Beyond 114.78, price would enter a high-volatility zone where momentum extensions toward 115.20–115.50 could become feasible under stronger risk-on conditions and sustained AUD support.
However, without a confirmed breakout above 113.40, upside remains technically capped and reactive rather than impulsive.
Support Structure: 112.70 Fragility and 112.20 Defense Line
Immediate downside focus remains on 112.70, which has become a short-term liquidity defense level. Repeated tests of this zone indicate active absorption, but weakening support integrity.
A decisive break below 112.70 would expose the 100-day SMA at 112.20, a structurally important level where medium-term buyers are expected to re-engage.
Below that, the next technical cushion is located at 112.00, corresponding with the lower Bollinger Band. This zone typically represents statistical oversold extension, where mean reversion probability increases significantly.
The broader bullish structure would only begin to deteriorate on a sustained close below 112.00, which would indicate a breakdown of the current consolidation channel.
Conclusion: Consolidation with Mild Bullish Structural Bias
AUD/JPY remains technically in a mildly bullish medium-term configuration, supported by price stability above the 100-day SMA at 112.20 and sustained positioning within the upper Bollinger regime.
However, short-term dynamics are dominated by intervention-driven yen strength, keeping price suppressed below 113.40 and reinforcing a range-bound consolidation structure.
The market is effectively locked between a 112.70–112.20 support cluster and a 113.40 resistance ceiling. A breakout above 113.40 would re-establish bullish expansion toward 114.78, while a break below 112.20 would signal deeper corrective pressure toward 112.00.
Until either level is resolved, AUD/JPY is expected to remain in a compressed technical equilibrium phase with mildly bullish underlying bias.