
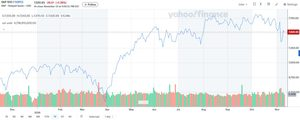
The S&P 500 closed at 7,549.94 on November 9, posting a 2.35% gain in a session that saw broad-based buying across sectors.
The rally represents the strongest single-day advance since April, fuelled by a combination of post-midterm clarity, technical buying off depressed levels, and a broad rotation out of defensive positioning.
Analysts from Sylverix note that while the rebound has lifted sentiment, the index remains 3.44% below its record close of 7,818.93 set on October 6.
The gap between current levels and all-time highs encapsulates the market’s unresolved tension between solid corporate earnings and an increasingly uncertain policy environment shaped by the new congressional configuration.
Technical Recovery Confronts Overhead Supply
The November 5 session delivered a dramatic intraday reversal, with the index plunging 4.36% to an intraday low of 7,353.73 before staged buying lifted prices off the lows.
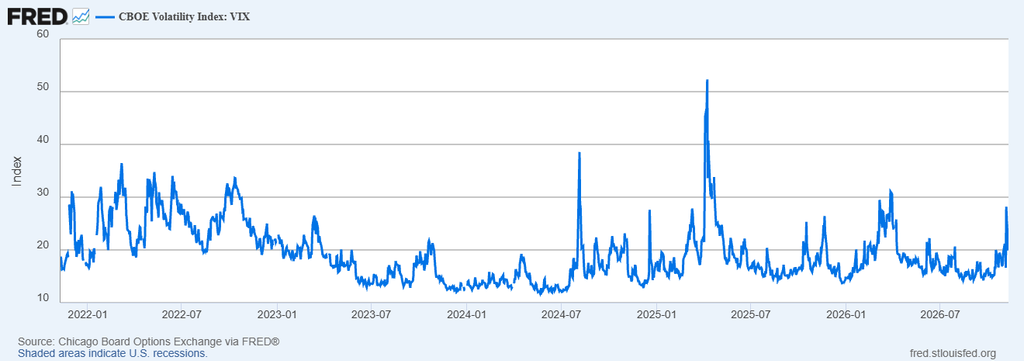
The speed and depth of the sell-off triggered a spike in the VIX to 28, reflecting elevated hedging demand, increased options market stress, and a sharp repricing of near-term risk.
The subsequent rebound has reclaimed the 50-day moving average and pushed the RSI back above 50 on the daily timeframe, signalling a shift from oversold to neutral momentum.
However, resistance at the $7,693 to $7,700 zone, where the fast-moving averages converge with former support turned resistance, represents the next technical hurdle that bulls must clear.
The broader technical structure shows a pattern of higher lows since the April correction, suggesting the longer-term uptrend remains intact.
Sector Rotation and Macro Drivers
The post-midterm rally has not been uniform across sectors. Healthcare led the advance, with the XLV ETF rising more than 2% and approaching a major resistance level around $150 that dates back to November 2024.
The healthcare sector’s RSI has reached 78.4, entering overbought territory on the daily chart. Technology, by contrast, has lagged noticeably as semiconductor concerns and regulatory uncertainty weigh on the Nasdaq-heavy components of the index.
Falling oil prices have provided indirect support for equities by easing inflation expectations and reducing input costs.
The energy sector’s weakness has been the broader market’s gain, as lower crude prices improve margin outlooks for consumer-facing, transportation, and industrial companies that had been squeezed by elevated fuel costs earlier in the year.
Bond market dynamics have also played a role, with declining long-term Treasury yields reducing the discount rate applied to future earnings and making equity valuations more attractive on a relative basis.
Goldman Sachs has set a year-end target of 8,000 for the S&P 500, representing approximately 6% upside from current levels.
The firm expects earnings-per-share growth to decelerate to 11% in the coming quarters but argues that the fundamental backdrop remains supportive of higher equity valuations, cautioning investors against trying to time a market top in the current cycle.
What Could Derail or Extend the Rally?
The bullish case rests on several pillars: historically positive seasonality in November and December, continued corporate earnings growth exceeding lowered expectations, and the possibility that the Federal Reserve pauses its tightening cycle at the December meeting.
If the VIX retreats from elevated levels toward 20 or below, it would signal a normalisation of risk appetite that typically precedes sustained equity gains and encourages institutional re-allocation into equities.
The bearish case centres on valuation and policy risk. The index trades at a forward P/E ratio above historical averages, leaving limited room for multiple expansion.
Any further tightening of financial conditions, whether through higher interest rates, dollar strength, or widening credit spreads, could compress multiples and trigger another leg lower.
Regulatory concerns affecting the technology sector, particularly around AI governance and advanced chip export restrictions, add an additional layer of uncertainty for the index’s largest constituents.
Traders should focus on whether the index can hold above the $7,541 support zone on any pullbacks. A clean break above $7,700 with strong volume confirmation would validate the recovery and target the $7,818 record high.
Failure to sustain above support, however, would reopen the risk of a retest of the $7,353 low, potentially deepening the correction toward the $7,000 structural support level that has underpinned the market throughout 2026.
The S&P 500 is navigating a familiar late-cycle pattern: strong enough to rally on positive catalysts, but fragile enough to sell off sharply on negative surprises.
The post-midterm rebound has bought time for the bulls, but the path to new highs will require clear evidence that earnings growth can outrun the mounting headwinds from policy uncertainty, regulatory risk, and the prospect of further monetary tightening.