
Chainlink is trying to defend the psychological $10 mark after one of its weakest stretches of the year, even as news from traditional finance keeps arriving. The research team at AchievementsAI examines LINK, which trades near $10.28, the reasons behind the slide and the levels that could decide the next move.
A Long Slide Meets Fresh Institutional News
The token has shed about 30% since the start of October, and Tuesday added another decline of roughly 3%. On Wednesday the price edged up slightly, which looks more like a pause than a recovery, since buyers have not yet shown the strength needed to change the direction of the trend.
The weakness stands out because the news flow is positive. Moody’s Ratings finished a test run on a network built around Chainlink’s cross-chain protocol, known as CCIP. In the pilot, credit information about tokenized assets was shared across several blockchains at once, which is exactly the kind of use case that supporters of the project want to see.
Meanwhile, Charles Schwab has opened access to LINK for clients of its crypto service. When a large brokerage with millions of customers lists a token, it improves the project’s reputation and makes it easier for traditional investors to buy it. These developments suggest that adoption keeps growing even while the price struggles.
For the project, the Moody’s pilot is also a proof of concept. Credit data that can travel between blockchains without manual work could one day serve lenders, issuers and investors who need reliable information about tokenized bonds and loans. Such use cases take time to develop, though, and they rarely translate into immediate buying.
Still, headlines about partnerships rarely change the trend by themselves. The market usually needs a combination of higher demand, improved sentiment and a technical break before a long decline reverses.
Sellers Control The Derivatives Market
Futures data shows that bears are still in charge. The ratio between aggressive buy orders and aggressive sell orders in LINK futures has dropped to 0.90. A reading under 1.00 means that market sell orders outweigh buy orders, so sellers are hitting resting bids and are willing to accept lower prices to exit.
This behavior often appears when traders rush to close positions, and it can accelerate a decline. Until this ratio returns above 1.00, any bounce in LINK is likely to be fragile. A recovery of the ratio, together with rising prices, would be an early sign that the pressure is easing.
A Technical Picture That Remains Bearish
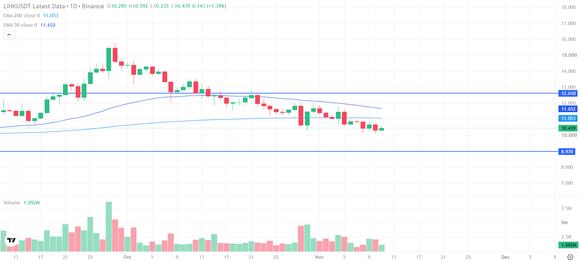
In the daily timeframe, LINK has been moving lower since the start of October and now trades under both of its key exponential moving averages. The 50-day line is near $11.65, and the 200-day line is near $10.99. Both sit above the price, so they act as moving barriers, and the downtrend will not be in doubt until the price climbs back over them.
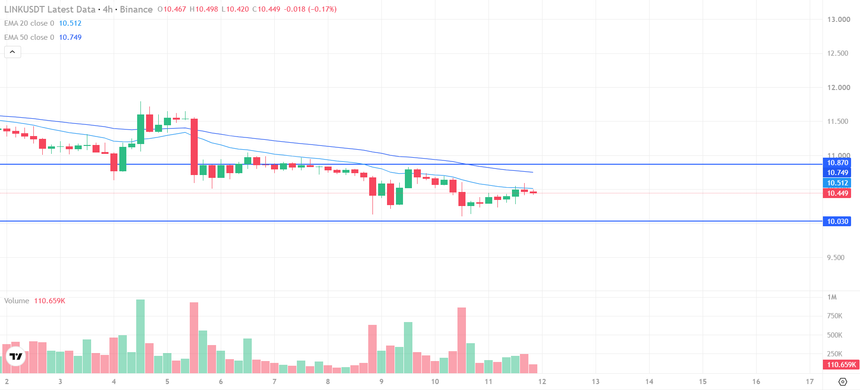
Right below these averages sits a horizontal ceiling at $10.87. Together, the three levels form a crowded overhead zone where sellers may reappear on every rally.
Momentum indicators agree with that view. The RSI reading is about 36. That is weak, but it is not yet low enough to signal an oversold market, so there is still room for another drop. The MACD indicator remains under its zero line, which confirms that downward momentum is dominant.
Support And Resistance Levels
The first support is $10.03, a level that the price has defended recently. A decisive break below it would open the way toward $8.97, and deeper floors appear at $7.85 and $7.01, where buyers might attempt a stronger recovery.
On the upside, the first resistance is $10.87, then the slower average near $10.99 and the faster one near $11.65. Closing the day above all of them would ease the selling pressure and make $12.61 the next target.
What Traders Can Do
Given the bearish structure, many traders may prefer to wait for confirmation instead of guessing a bottom. Buyers can look for a daily close above $10.99, followed by a retest that holds, and then aim for $11.65 and $12.61, with a stop-loss under $10.03.
Sellers can watch for a daily close below $10.03, which would make $8.97 the first target and $7.85 the next. Rallies toward $10.87 that fail on weak volume could also give sellers a chance to enter, with a stop above the 50-day average.
Position size should stay moderate, since crypto prices can move several percent within hours, and a stop-loss should be placed before every trade.
Conclusion
Chainlink faces a clash between strong institutional news and a weak price trend. The $10.03 support and the $10.87 to $10.99 resistance zone are the levels to follow.
Traders following Crypto strategies should watch the derivatives ratio, the reaction to the moving averages and any new adoption news, since these factors are likely to guide the next move in LINK.