
Nvidia shares suffered their sharpest single-session decline in over a year on November 5, 2026, tumbling 9.26% to close at $181.60 as a broad sell-off swept through semiconductor and artificial-intelligence stocks.
The Philadelphia Semiconductor Index dropped roughly 12% in the same session, while the Nasdaq 100 shed more than 6%, marking one of the most aggressive risk-off episodes since the regional banking crisis of 2023.
Fonndure evaluates the technical damage, the fundamental backstory, and what the approaching third-quarter earnings report in November could mean for short-term direction. Despite the headline shock, the sell-off arrived without a company-specific catalyst.
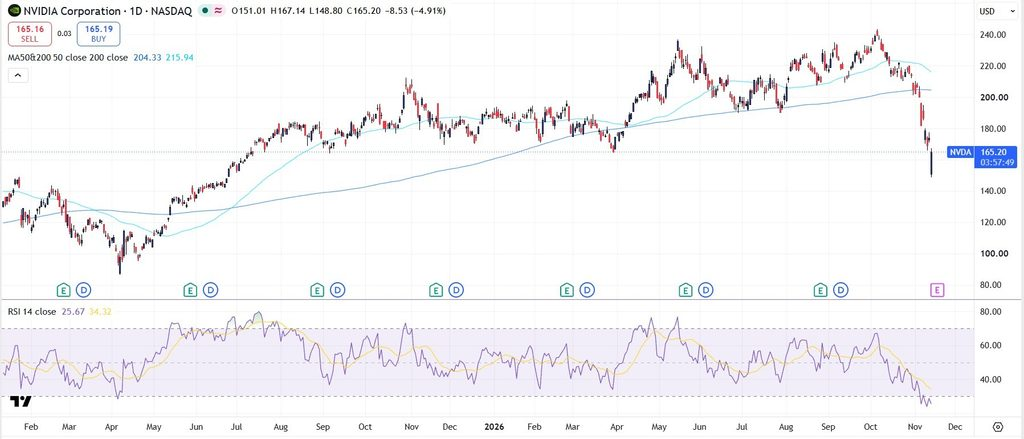
Technical Breakdown: Key Levels After the October Peak
The November 5 close of $181.60 sits roughly 25% below the 52-week high of $243.37 recorded on October 6, 2026. That peak also represented the stock’s all-time high, which makes the subsequent decline technically significant.
From October 7 to November 5, the stock surrendered 23.5%, outpacing the S&P 500’s 5.7% loss over the same window.
Immediate resistance stands at $190, the pre-crash session’s opening level. A failure to reclaim that zone within the first two sessions of the following week would reinforce the bearish structure and open a path toward the $164 to $170 support cluster that underpinned the March bottom.
Fundamental Picture: Revenue Machine Meets Valuation Scrutiny
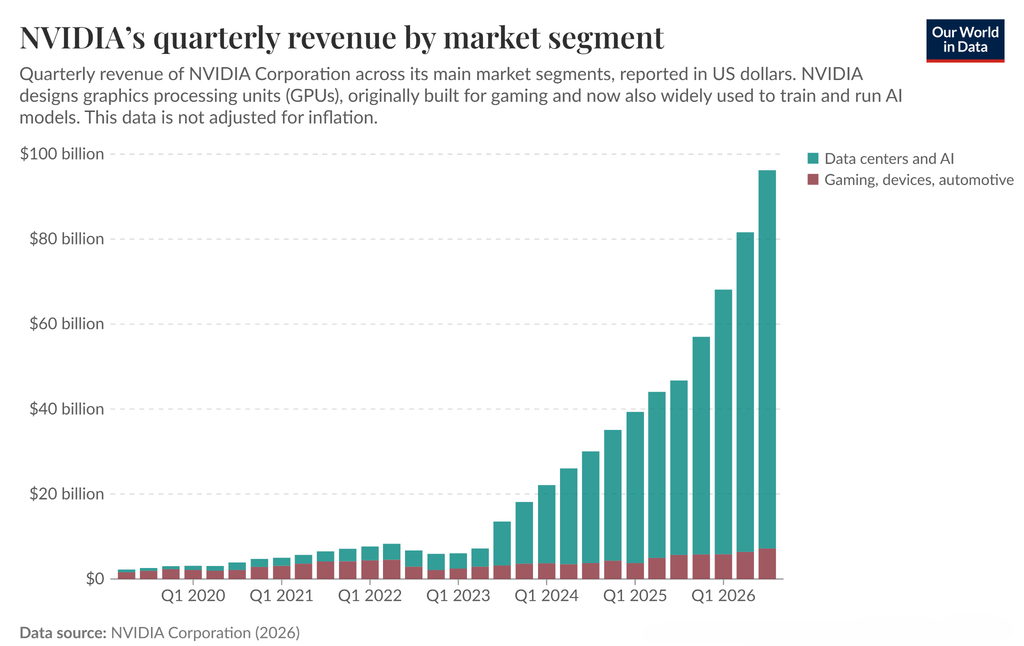
The fundamental case for Nvidia remains compelling on the surface. Second-quarter revenue for fiscal 2027 came in at $96.2 billion, a staggering 106% increase year-over-year, driven almost entirely by data-centre demand.
That segment alone generated $89.0 billion, representing 92.5% of total revenue and growing at 117% annually.
Management guided third-quarter revenue to approximately $108 billion, plus or minus 2%, with gross margins expected near 74%.
If achieved, the sequential jump of roughly $12 billion would represent one of the largest quarter-over-quarter increases in the company’s history and further cement its dominance in AI infrastructure spending.
Yet the sell-off highlights a growing tension between earnings growth and multiple compression. At the November 5 closing price, the stock traded at roughly 14.5 times trailing twelve-month sales, compared with 3.2 times for the broader S&P 500.
The trailing P/E ratio compressed to approximately 23, down from peaks above 35 earlier in the year, suggesting the market is already pricing in a slower earnings growth trajectory.
Geopolitical Headwinds and Insider Activity
Reports on November 4 indicated that major Chinese AI developers anticipated receiving only about 1% of the advanced Nvidia chips they had ordered.
China once represented a meaningful portion of data-centre revenue, and the continued tightening of chip export controls removes a growth lever that analysts had previously modelled into forward estimates.
Insider activity has also drawn attention. Executive-level sales totalled approximately $947 million in net insider selling over the ninety days leading up to early November 2026, including transactions exceeding $297 million and $235 million in September alone.
While insider sales are routine for executives with large equity compensation packages, the pace and scale have fuelled bearish sentiment among retail investors monitoring filing disclosures.
The broader competitive landscape adds complexity. Major cloud computing providers have begun developing their own custom AI training chips, with several announcing plans to reduce dependence on third-party hardware by 2028.
What to Watch: The November Earnings Catalyst
The fiscal third-quarter earnings release scheduled for November after market close represents the most significant near-term catalyst.
Consensus analyst expectations centre on the $108 billion revenue guide, and any shortfall would likely accelerate the current downtrend given elevated volatility expectations.
The implied move priced into options markets suggests a potential swing of 8% to 10% in either direction around the report, considerably wider than the 7% gain observed after the August earnings call.
The average analyst price target remains near $327, implying roughly 80% upside from the November 5 close and reflecting the consensus view that the sell-off is disconnected from the company’s earnings trajectory.
However, such a gap between price and target during a period of multiple compression often signals that estimates themselves may face downward revision rather than a swift recovery to prior highs.
Volume patterns offer an additional lens. The November 5 session recorded approximately 487 million shares traded, nearly three times the 90-day average daily volume.
Such elevated turnover during a sell-off typically indicates institutional repositioning rather than retail panic, and the breadth of the volume spike suggests that portfolio managers are actively de-risking ahead of the earnings event.