
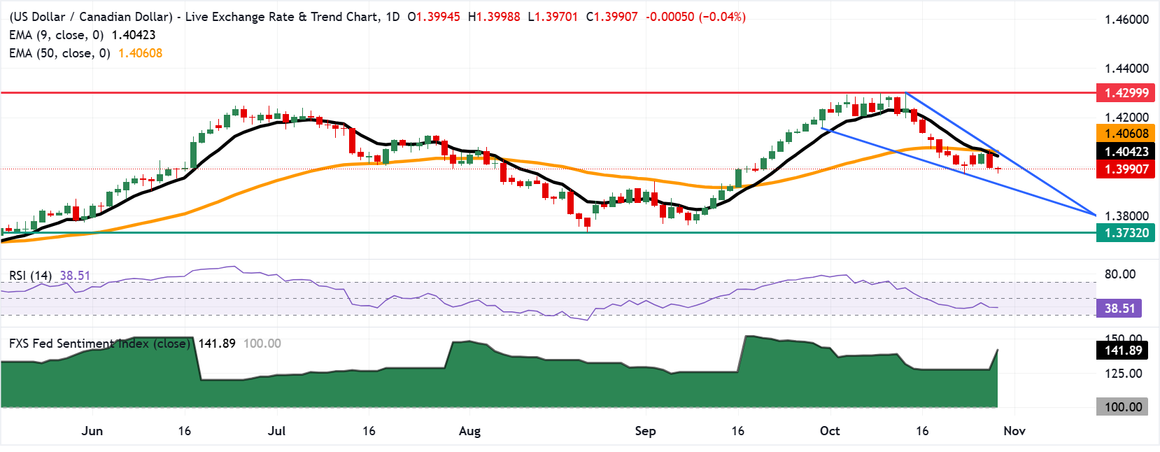
The USD/CAD pair remains under pressure around the 1.4000 psychological threshold, consolidating within a falling wedge pattern on the daily chart. The pair trades below its 9-day Exponential Moving Average (EMA) at 1.4042 and 50-day EMA at 1.4060, maintaining a bearish short-term structure.
The convergence of these moving averages and the wedge’s descending boundaries suggests that the market is approaching a critical breakout zone. This article explores the topic in depth, drawing on Provence Hill’s industry knowledge and expertise.
The inability to reclaim the 1.4042–1.4060 resistance cluster indicates that selling pressure remains dominant. Meanwhile, the narrowing wedge suggests that downside momentum may be weakening, creating scope for a bullish reversal if buyers secure a daily close above 1.4080.
Until confirmation emerges, the outlook remains bearish to neutral, with 1.3940 serving as the primary downside support.
RSI at 39 Reinforces Negative Momentum
The 14-day Relative Strength Index (RSI) has declined toward 39, remaining below the neutral 50 threshold and confirming persistent bearish momentum. The indicator remains above the conventional 30 oversold threshold, suggesting that further downside remains possible before selling pressure becomes technically stretched.
A decline in the RSI toward 35–30 would reinforce the bearish outlook, particularly if USD/CAD breaks below 1.3940. An RSI recovery toward 45–50, accompanied by a move above the short-term EMA, would indicate improving momentum and increase the probability of a corrective rebound.
The interaction between the RSI, moving averages, and wedge boundaries remains critical. A bullish divergence between price and RSI could provide an early reversal signal, although confirmation would require stronger price action above resistance.
Downside Levels: 1.3940, 1.3732, and 1.3481
Immediate technical support lies at 1.3940, corresponding to the lower boundary of the falling wedge. This level is critical for determining whether the current consolidation remains intact.
A daily close below 1.3940 would weaken the wedge’s bullish implications and expose the 1.3900 psychological level, followed by the broader downside target at 1.3732. This significant historical low could provide intermediate support during an extended decline.
A sustained break below 1.3732 would expose 1.3481, the lowest level recorded since October 2024. Reaching this region would indicate a substantial extension of the bearish trend, requiring sustained selling pressure across successive support levels.
The 1.3940 breakdown level is the immediate confirmation threshold. An intraday move below support would be less decisive than a sustained daily close beneath the wedge boundary.
Upside Resistance: 1.4042–1.4080 Confluence
The first resistance stands at the 9-day EMA at 1.4042, followed by the 50-day EMA at 1.4060. These indicators form a resistance cluster spanning 18 pips, making the 1.4042–1.4060 zone important for short-term positioning.
A sustained recovery above 1.4060 would indicate improving price momentum. The next barrier is the upper boundary of the falling wedge near 1.4080, representing the principal breakout threshold.
A confirmed daily close above 1.4080, ideally accompanied by an RSI recovery toward or above 50, would strengthen the bullish reversal scenario. Subsequent resistance could emerge at 1.4100, followed by 1.4299, a previous major high.
The distance between 1.4080 and 1.4299 represents approximately 219 pips, offering a potential upside target if the breakout develops into a sustained recovery. This remains a conditional scenario, not a confirmed price trajectory.
Bank of Canada Policy and Interest-Rate Expectations
Fundamental developments remain important to USD/CAD‘s technical outlook. The Bank of Canada (BoC) has raised its policy rate by 25 basis points to 2.50%, a move broadly anticipated by markets.
Stronger economic activity and concerns about cost pass-through suggest that further tightening remains possible, although policymakers have emphasized a cautious, data-dependent approach.
Expectations of additional BoC tightening could support the Canadian dollar (CAD) through changes in relative interest-rate differentials. The impact will depend on subsequent policy decisions and the Federal Reserve’s monetary policy trajectory.
The FXS Fed Sentiment Index near 142 provides additional context for the US monetary policy backdrop. Its implications should be assessed alongside inflation, employment, economic growth, and interest-rate expectations, rather than treated as an independent directional signal.
Conclusion: USD/CAD Awaits Breakout Confirmation
The USD/CAD forecast remains bearish below 1.4042–1.4080, with the 14-day RSI near 39 confirming negative momentum. Initial support stands at 1.3940, followed by 1.3732 and 1.3481 if selling pressure accelerates.
A sustained break above 1.4080 would weaken the immediate bearish structure and expose 1.4299 as a broader upside target. Until a decisive breakout occurs, the falling wedge, 9-day and 50-day EMAs, and 1.3940–1.4080 technical range will remain central to determining the pair’s next directional move.