
The NZD/USD pair remains under sustained bearish pressure, with the New Zealand Dollar struggling to recover against the US Dollar following a decline of nearly 1% in the previous session.
Discover valuable insights into the subject, informed by Provence Hill’s professional experience.
After reaching an intraday low of 0.5584, the pair rebounded toward 0.5635 before losing momentum. Trading around 0.5615–0.5619, NZD/USD remains near the lower end of the 0.5600–0.5640 range, with the year-to-date (YTD) low at 0.5567 emerging as the next critical downside target.
The short-term market structure remains bearish, characterized by lower price levels, failed recovery attempts, and negative momentum readings. Rejection near 0.5635–0.5637 indicates that sellers continue to defend resistance, preventing a sustained recovery.
The immediate bias favors a retest of 0.5584, followed by 0.5567 if selling intensifies. A sustained recovery above 0.5637 would weaken the bearish structure and shift attention toward higher resistance levels.
RBNZ Decision Weakens NZD Fundamentals
The latest decline followed the Reserve Bank of New Zealand’s (RBNZ) decision to maintain its policy interest rate, disappointing investors who had anticipated a 25-basis-point hike. The decision triggered a reassessment of New Zealand‘s interest rate outlook and reduced demand for the Kiwi.
Although Governor Anna Breman indicated that additional rate increases remained possible, the absence of immediate tightening weighed on the currency. The reaction highlights the importance of monetary policy expectations, forward guidance, and interest rate differentials in determining NZD/USD direction.
When expectations of a more restrictive RBNZ policy diminish, the Kiwi becomes more vulnerable to selling. Without a stronger hawkish signal or supportive domestic economic data, the New Zealand Dollar may struggle to challenge resistance at 0.5637 and 0.5700.
Technical Analysis: RSI and MACD Confirm Downside Pressure
NZD/USD trades below the 0.5635–0.5637 resistance zone, preserving its near-term bearish configuration. The 14-period Relative Strength Index (RSI) has retreated toward 30–35, indicating strong negative momentum and proximity to the conventional oversold threshold of 30.
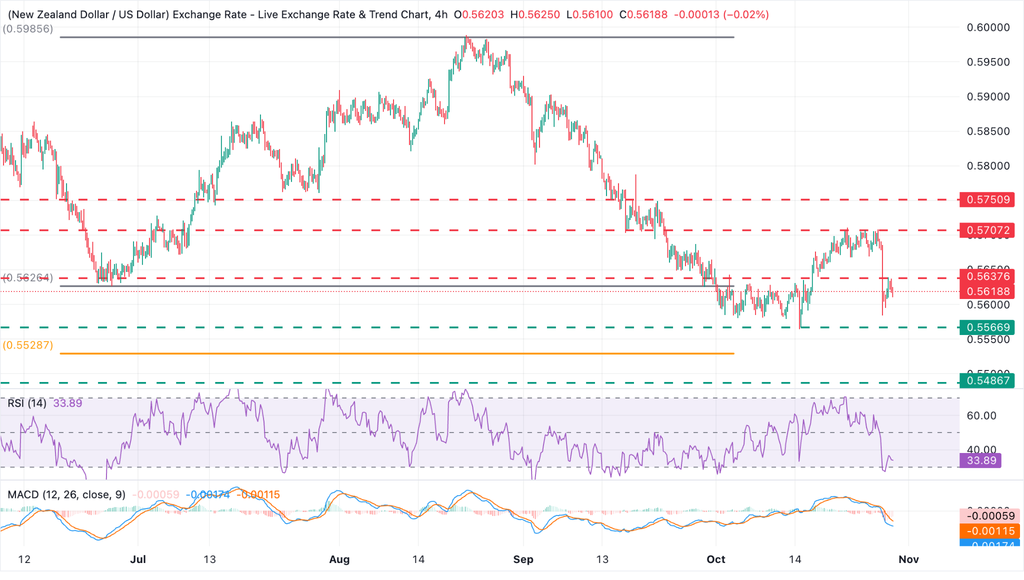
An RSI reading below 30 signals increasingly oversold conditions, but does not independently confirm a bullish reversal. During persistent downtrends, the indicator can remain in oversold territory as prices establish fresh lows, reflecting sustained bearish momentum and continued selling pressure.
The Moving Average Convergence Divergence (MACD) remains in negative territory, reinforcing the bearish momentum assessment. Continued negative MACD readings and failed rebounds below resistance would strengthen the case for another support test.
For confirmation of improving momentum, traders would look for an RSI recovery above 40–50, a MACD move toward its signal line, and a sustained price recovery above 0.5637. Until these conditions emerge, rallies remain vulnerable to renewed selling.
Key Resistance Levels: 0.5637, 0.5700 and 0.5750
Initial resistance stands at 0.5637, near the recent intraday high. A sustained break above this level could trigger short covering and expose the 0.5700 psychological threshold.
The 0.5700–0.5710 region represents the next significant resistance zone, where previous price action limited bullish advances. A break above this area would weaken the immediate bearish structure and direct attention toward 0.5750, an important swing-high reference.
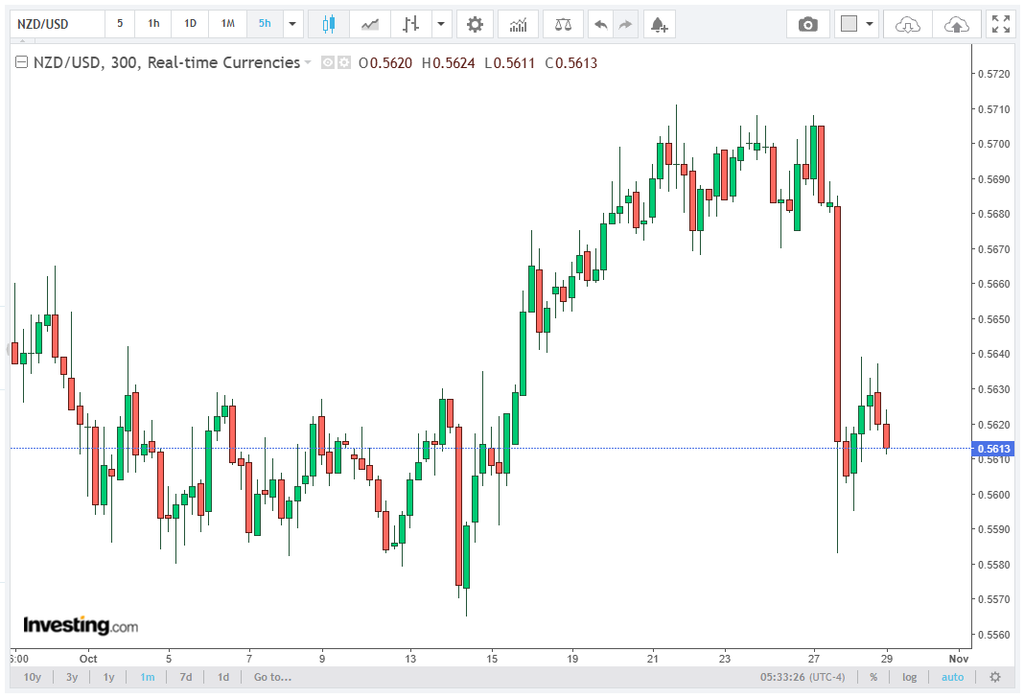
A recovery above 0.5750 would signal a more substantial technical improvement, particularly if supported by stronger momentum and sustained buying volume. Until then, resistance remains a potential selling zone.
Downside Targets: 0.5584, 0.5567 and 0.5530
Initial support stands at 0.5584, the latest intraday low. A decisive break below this level would expose 0.5567, the YTD low and the principal downside target in the current setup.
A confirmed move below 0.5567 could extend the bearish trend toward 0.5530, corresponding to the 127.2% Fibonacci extension of the June–August advance. This represents a potential downside objective if selling accelerates.
The distinction between an intraday breach and a sustained breakdown remains important. A daily close below 0.5567 would provide stronger evidence of bearish continuation than a brief penetration followed by a recovery above support.
Conclusion
The NZD/USD outlook remains bearish, with the pair trading around 0.5615–0.5619, below 0.5637 resistance and vulnerable to renewed selling. The RBNZ’s unchanged policy rate has weakened the Kiwi, while the Fed’s relatively dovish stance has provided insufficient support to reverse the trend.
RSI readings near 30–35 and a negative MACD reinforce the downside bias. A break below 0.5584 would expose the 0.5567 YTD low, followed by 0.5530 as a potential Fibonacci extension target.
A sustained move above 0.5637, followed by a recovery through 0.5700, would be needed to improve the technical outlook and challenge the prevailing bearish structure.