
Silver traded near $57.05 per ounce in mid-October 2026, holding well above its pre-2025 highs but sitting approximately 53% below its all-time record of $121 reached in late January.
The metal has maintained a floor above the $55 level since early Q4, though upside momentum has stalled against a persistent descending trendline from the January peak.
Analysts at AchievementsAI examine the technical setup and macro catalysts that will likely determine whether silver can mount a sustained recovery into year-end, or whether a retest of lower support levels awaits before the market finds directional clarity.
A Descending Trendline Defines the 2026 Narrative
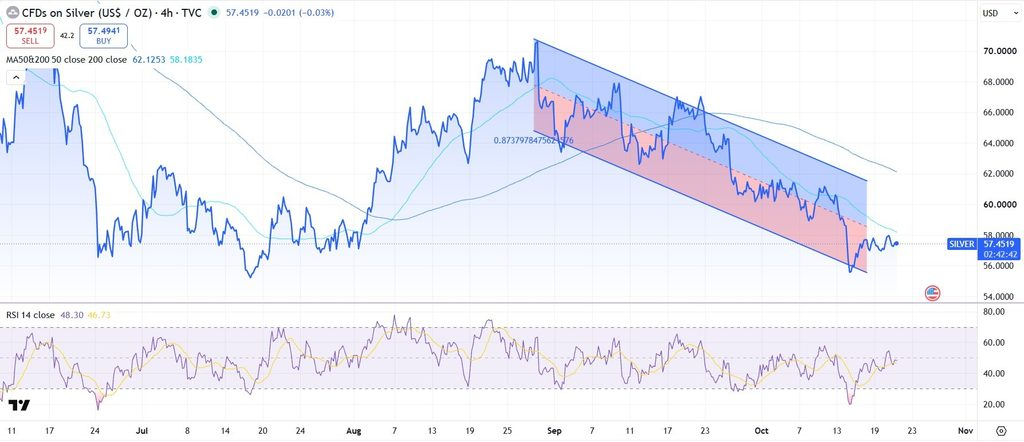
The dominant technical feature on silver’s daily chart is the descending trendline originating from the January 2026 highs.
Price has tested this line on multiple occasions throughout the year without achieving a clean breakout. The most recent approach placed silver near $63 in mid-September before sellers reasserted control and drove a pullback toward the current range.
Silver currently trades above its 200-day moving average, a constructive sign that suggests the longer-term trend remains intact despite the pullback from record territory.
The 50-day SMA sits near $65.52 on the four-hour timeframe, acting as dynamic resistance that has capped recent rallies and rejected multiple intraday attempts to break higher.
The RSI on the daily chart reads approximately 48, placing silver in neutral territory. This is neither an overbought nor oversold reading, leaving room for a directional move in either direction depending on the incoming macro data and the Federal Reserve’s next policy statement.
Industrial Demand Provides a Structural Floor
Unlike gold, silver’s price dynamics reflect a dual identity as both a precious metal and an industrial commodity. Solar panel manufacturing, electric vehicle production, and 5G infrastructure deployment continue to absorb physical silver at elevated rates.
The Silver Institute has consistently noted that fabrication demand remains robust heading into 2027, with photovoltaic applications alone accounting for a growing share of total offtake.
HSBC raised its 2026 silver price forecast, projecting the metal to average $75 per ounce for the year. JP Morgan’s estimate sits at $81, while Bank of America’s bull case extends to $309 under extreme supply deficit scenarios.
The wide range of analyst projections underscores the uncertainty embedded in silver’s outlook and the sensitivity of its price to both monetary policy shifts and industrial demand cycles.
The market deficit has narrowed in recent months, according to HSBC, which could cap further appreciation in the near term. Meanwhile, ETF outflows have periodically eased spot supply tightness, providing relief during profit-taking episodes.
However, mine supply growth remains constrained, with primary silver production concentrated in a handful of jurisdictions where permitting timelines continue to lengthen.
The Fed’s October Decision as a Near-Term Catalyst
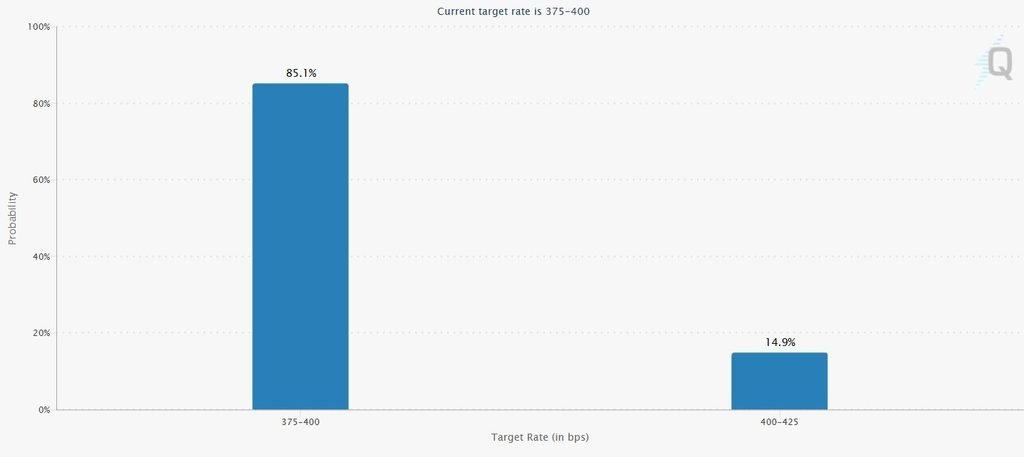
The Federal Reserve’s next meeting represents the most significant near-term event risk for silver.
CME FedWatch data earlier in the month showed rate hike odds at approximately 38%, down from 51% following softer-than-expected US inflation data. The shift in expectations has provided some support to the precious metals complex broadly.
Rising oil prices have complicated the inflation picture, with September consumer prices accelerating on a surge in gasoline costs.
If the Fed signals renewed hawkishness, silver could face selling pressure as real yields rise and the dollar strengthens. Conversely, a dovish hold or forward guidance suggesting a pause would likely support silver and gold alike.
The US jobs report published earlier in October showed an estimated 90,000 positions added in September, a number that aligns with a gradually cooling labour market but remains above the threshold that would indicate an imminent recession.
This data point adds to the uncertainty around the Fed’s next move and keeps silver traders positioned cautiously ahead of the announcement.
Key Levels and Scenarios for Q4
On the bullish side, a sustained breakout above the descending trendline and the $65 resistance zone would open the path toward $70 and potentially the $75 area that multiple forecasters have identified as a 2026 average.
The Fibonacci extension from the October 2025 low to the January 2026 high places the 61.8% retracement near $72, a level that could attract institutional buying interest.
On the bearish side, a decisive break below $55 would expose the October 2025 breakout level near $50. This scenario would likely require a materially hawkish shift from the Fed or a significant deterioration in industrial demand indicators from China and Europe.
Silver’s consolidation phase has lasted nine months. Historical precedents suggest that extended sideways periods in metals markets tend to resolve with high-conviction directional moves.
Whether that resolution favours bulls or bears will depend largely on the interplay between monetary policy expectations and the pace of industrial silver absorption through the remainder of 2026.