
BTC/USD maintains a cautiously bullish technical structure, with Bitcoin holding above the $82,000 support level amid declining US Treasury yields and continued institutional accumulation. The cryptocurrency has gained 3.40% from its monthly low and about 45% from its July low, signaling a strong recovery and improving momentum.
Explore Lucovox’s expert insights and in-depth analysis of this subject in this article.
Bitcoin’s ability to remain above the 80,000–82,000 support zone suggests that buyers continue to absorb selling pressure. This area is a key technical threshold, as a breakdown could trigger further liquidations and weaken the prevailing bullish structure.
Continued consolidation above support could create the conditions for an upside breakout, particularly if trading volume increases and broader financial conditions remain supportive.
Institutional Accumulation Supports the $100,000 Forecast
Michael Saylor’s $100,000 Bitcoin prediction has strengthened the bullish narrative. His assessment suggests that Bitcoin has established a market bottom and that the next significant price movement could be upward.
From $82,000 to $100,000, the projected advance would represent approximately 21.95% upside, although achieving this target would require sustained buying pressure and favorable market conditions.
Strategy continues to reinforce its long-term Bitcoin exposure. The company reportedly purchased $21 million worth of BTC, bringing its holdings to 848,250 coins, valued at approximately $70.6 billion. This position represents around 4% of Bitcoin’s maximum supply of 21 million coins, demonstrating the scale of its institutional commitment.
Meanwhile, Strive acquired an additional 3,311 BTC, increasing its holdings to 32,773 coins and placing it among the world’s largest corporate Bitcoin holders. Continued corporate accumulation can reduce the available liquid supply and amplify upward price movements when demand increases.
Treasury Yields and Inflation: Key Macroeconomic Drivers
Macroeconomic developments remain critical to Bitcoin’s price direction. The US 10-year Treasury yield declined to 5.213%, while the five-year yield fell to approximately 5.00%. Lower yields can improve the relative attractiveness of risk-sensitive assets by reducing the appeal of fixed-income investments.
The impact depends on movements in real interest rates, which reflect nominal yields adjusted for inflation expectations. Falling real yields may support Bitcoin by reducing the opportunity cost of holding a non-yielding asset. However, persistent inflation could delay monetary easing, strengthen the US dollar, and undermine demand for cryptocurrencies.
The upcoming US Consumer Price Index (CPI) report represents a significant volatility catalyst. Economists expect headline inflation to reach approximately 3.6%, exceeding the Federal Reserve’s 2.0% target by 1.6 percentage points.
An unexpectedly high reading could increase expectations of restrictive monetary policy, putting pressure on BTC/USD. A softer-than-expected result could improve risk appetite and support a breakout above nearby resistance.
BTC/USD Technical Analysis: $83,060 Is the Breakout Level
From a technical perspective, Bitcoin’s immediate bias remains bullish but unconfirmed. The price has maintained support above $80,000, while the Supertrend indicator remains green, indicating that its current trend signal favors buyers.
BTC/USD has also moved above its 50-day Exponential Moving Average (EMA), suggesting improving momentum relative to its medium-term trend. Nevertheless, traders should evaluate the EMA’s slope, price positioning, and potential retests before treating this development as confirmation of a sustained uptrend.
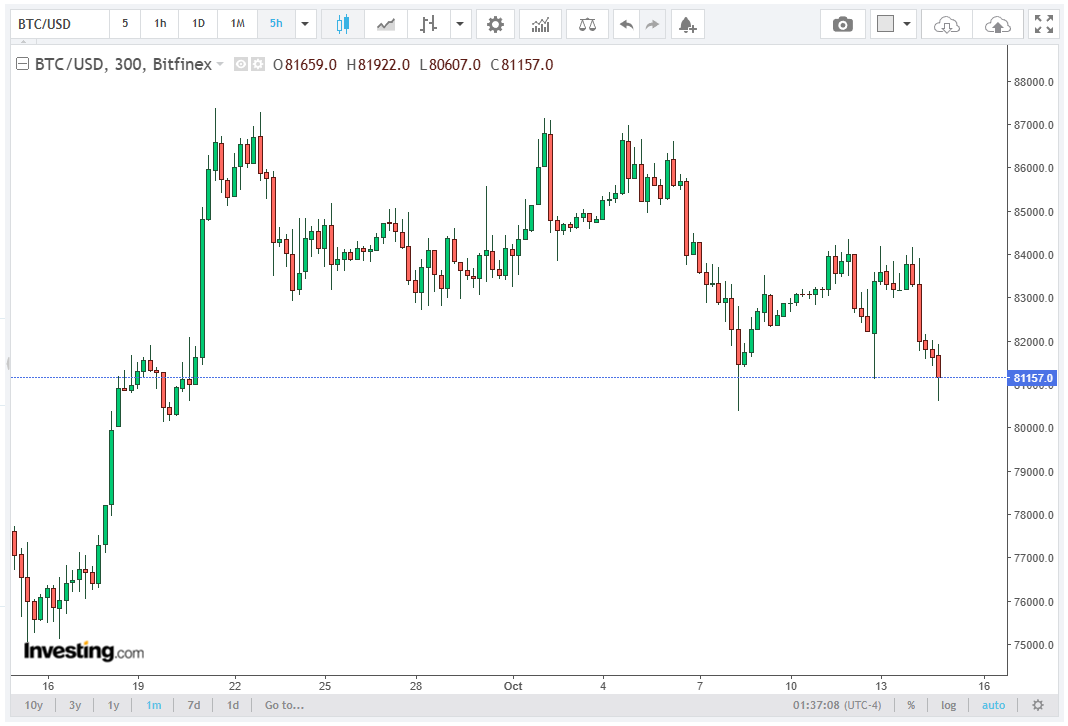
The immediate resistance level stands at $83,060. A decisive daily close above this threshold, accompanied by stronger spot trading volume, would provide evidence that buyers are gaining control. A breakout without meaningful volume expansion, however, could become a false breakout, exposing the market to a subsequent retracement.
If buyers clear $83,060, the next upside target is $87,198, representing approximately 4.98% upside from the resistance level. A sustained move above this threshold could expose the $90,000 resistance zone, approximately 8.35% above $83,060. Reaching $100,000 from $83,060 would require a further advance of approximately 20.39%.
On the downside, a decisive break below $80,000 would weaken the bullish structure and increase the probability of deeper consolidation. Traders should monitor relative strength, trading volume, moving-average positioning, and derivatives funding rates to assess whether bullish momentum is supported by sustainable demand rather than excessive leverage.
Conclusion: Bitcoin’s Bullish Trajectory Depends on Confirmation
Bitcoin retains a moderately bullish outlook, supported by institutional accumulation, improving technical momentum, and declining Treasury yields. A confirmed breakout above $83,060 could open the way toward $87,198 and $90,000, while $100,000 remains the broader bullish objective.
Nevertheless, 3.6% inflation, $106 oil, and geopolitical uncertainty present substantial risks to the recovery. Sustained appreciation will require stronger trading volume, successful resistance-to-support conversion, and favorable macroeconomic conditions.
Until these factors align, the bullish setup remains constructive but conditional, making $83,060 resistance and $80,000 support the principal levels to monitor.