

The US 10-year Treasury yield remained close to 4.65% after a volatile week in global bond markets. Falling oil prices eased immediate inflation concerns, but uncertainty surrounding Federal Reserve policy and government borrowing kept yields elevated.
In this article, experts at ICU Markets examine whether the benchmark yield can fall toward 4.55% or whether renewed inflation pressure could produce another move toward 4.75%.
The Federal Reserve Leaves Rates Unchanged
The Federal Reserve kept its benchmark rate within the 3.50% to 3.75% range at its July meeting.
Three policymakers supported a quarter-point increase, highlighting disagreement over inflation and the direction of policy.
The decision helped shorter-term yields ease, but it did not calm the longer end of the Treasury market.
Investors remain unsure whether the Fed has finished tightening or is waiting for more evidence.
The Yield Curve Sends a Mixed Message
Shorter-term Treasury yields declined following the decision, while longer-dated yields moved higher.
The pattern suggests traders are less convinced about another immediate increase but remain worried about inflation, debt supply, and borrowing costs.
The market is separating the near-term Fed outlook from the wider fiscal picture.
That may keep the 10-year yield elevated even when expectations for the next meeting become less aggressive.
The Renko Chart Shows Lost Momentum
The first chart uses Renko bricks rather than conventional time-based candles. Each brick appears only after the yield moves by a set amount, removing smaller fluctuations.
The recent upward trend has lost momentum after the yield approached 4.75%.
A continued sequence of lower bricks would support a move toward 4.55%. A fresh upward reversal would place 4.75% and 4.85% back in view.
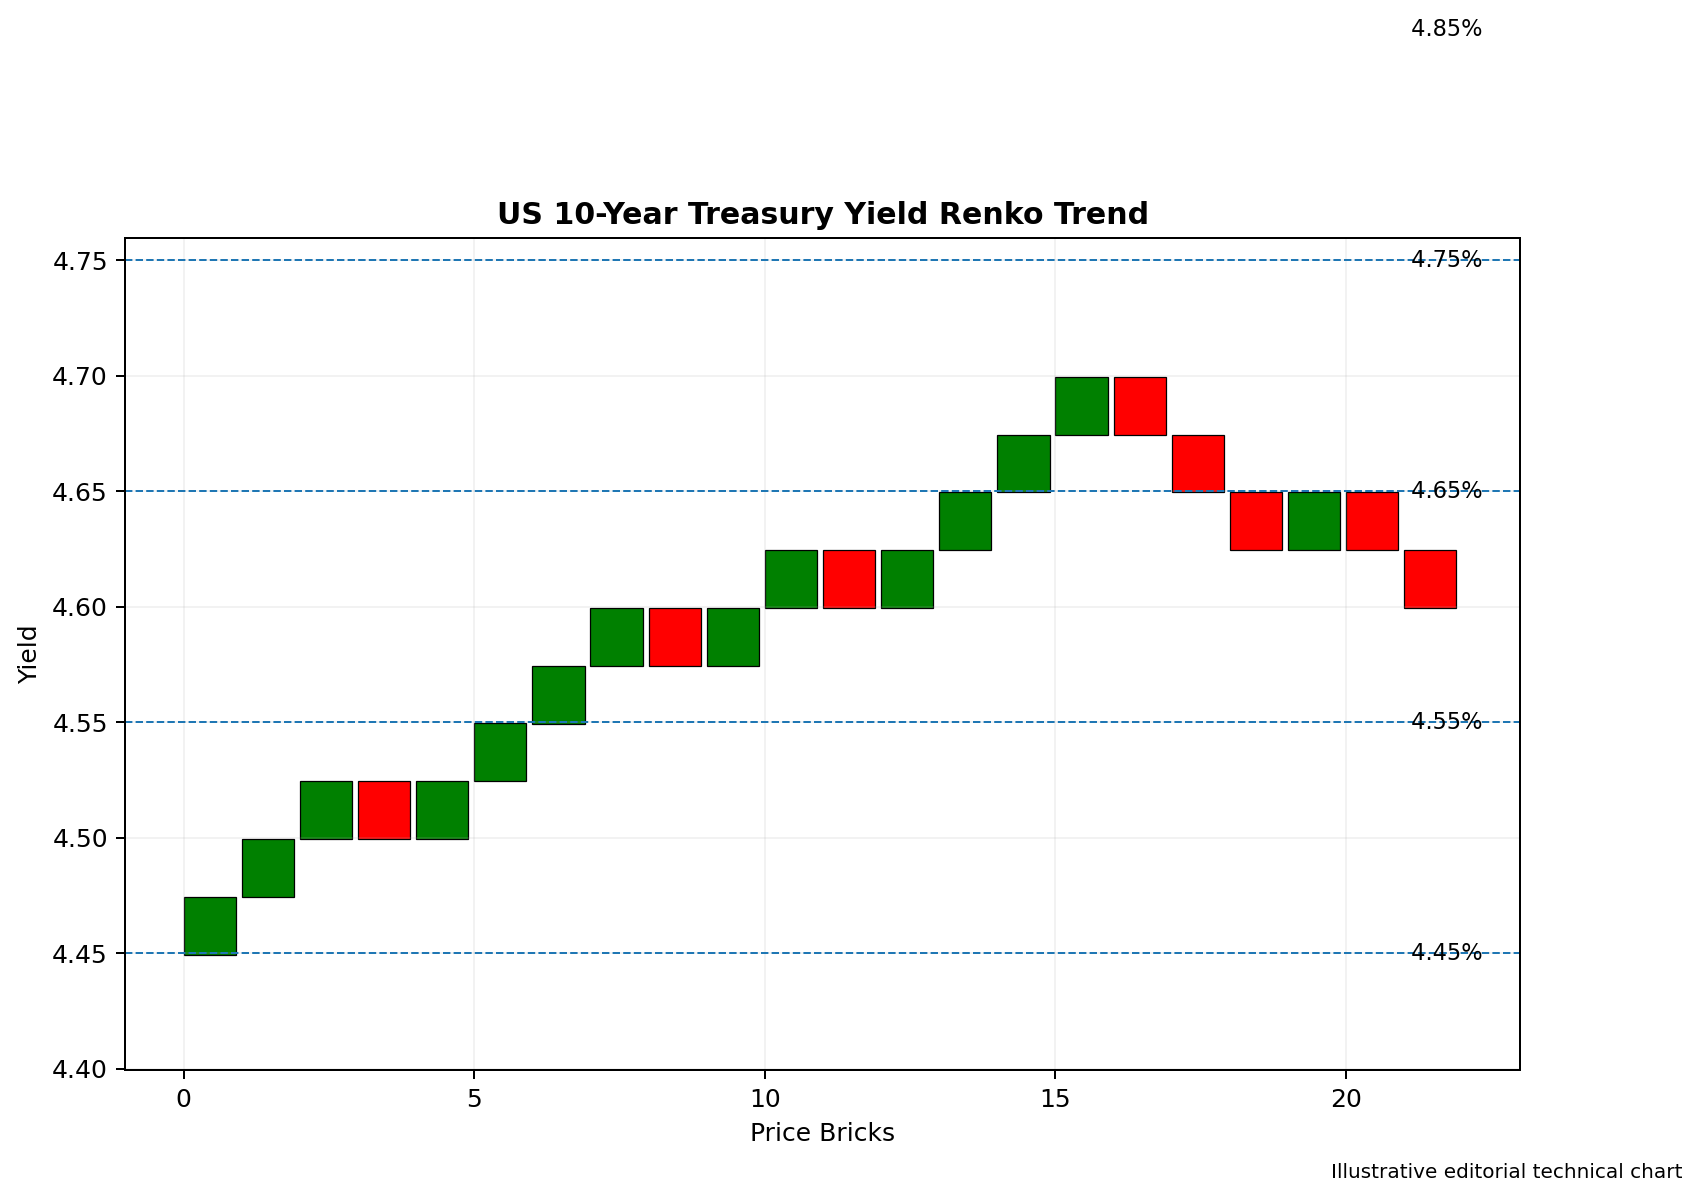
Image 1: US 10-Year Treasury Yield Renko Trend
Resistance Begins Around 4.75%
The first important resistance area sits near 4.75%. A sustained break above this level could expose 4.85%, followed by 5.00%.
A move above 4.75% would suggest inflation and debt-supply concerns are outweighing expectations of stable Fed policy.
The benchmark recently traded around 4.67%, while the 30-year yield climbed above 5.20%.
Those levels show that investors still demand substantial compensation for holding longer-term US debt.
Support Appears Near 4.55%
Initial support is positioned around 4.55%.
Holding above this area would preserve the wider upward structure and leave another challenge of 4.75% possible.
A break beneath 4.55% could expose 4.45%, followed by 4.35%.
A sustained decline below 4.45% would provide stronger evidence that the bond-market selloff is reversing.
Because bond prices and yields move in opposite directions, falling yields would signal renewed Treasury buying.
Williams %R Points to a Pullback
The second chart uses Williams %R to measure where the current yield sits within its recent range.
Readings near zero show yields trading close to the upper end, while readings near minus 100 indicate movement toward the lower end.
The indicator has moved away from its overbought region, suggesting the recent increase is undergoing a correction.
Further weakness would support a move toward 4.55%. A reversal above minus 20 would warn that upward pressure is returning.
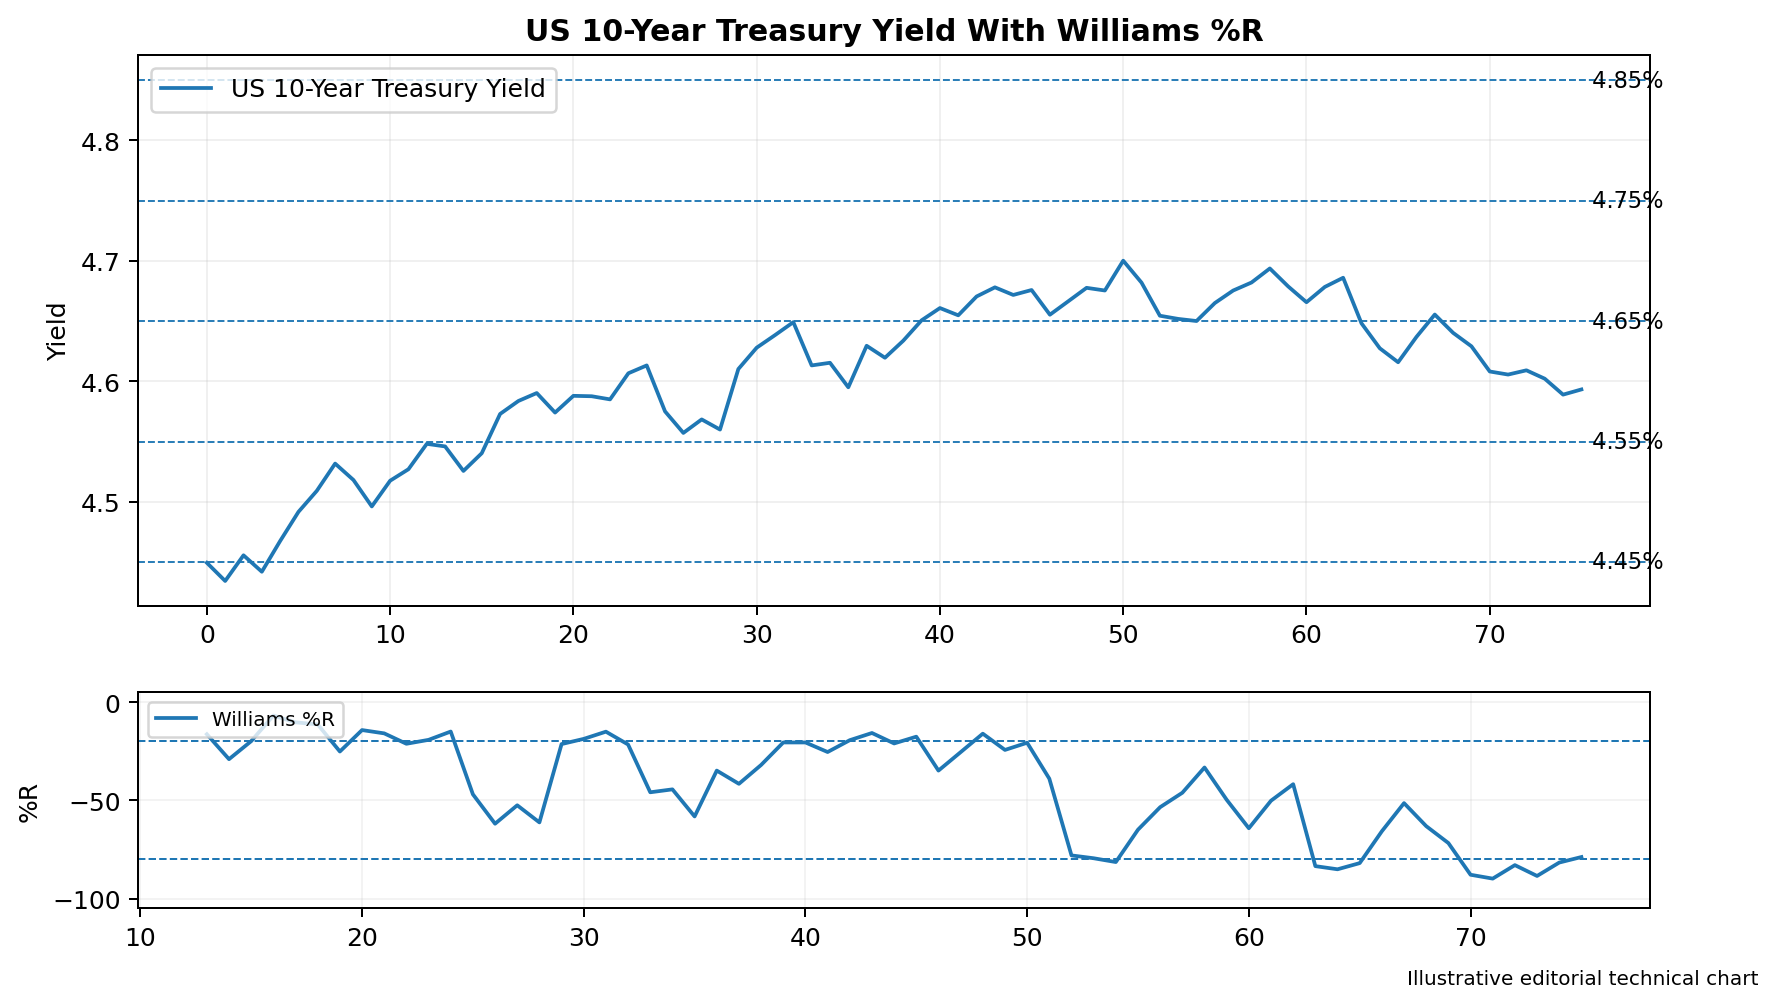
Image 2: US 10-Year Treasury Yield With Williams %R
Lower Oil Prices Reduce Inflation Fear
Crude prices dropped sharply as renewed diplomacy reduced concern about prolonged disruption to Middle East supply routes.
Lower energy prices remove one of the clearest near-term inflation risks facing the bond market.
Cheaper oil can feed through to transportation, manufacturing, and household fuel costs, reducing pressure on the Fed to raise rates again.
Long-Term Inflation Concerns Remain
Although oil weakness offers relief, US inflation remains above the Federal Reserve’s 2% objective.
Bond investors are still cautious because energy volatility, wage pressure, and government borrowing could keep inflation elevated.
The 10-year yield may struggle to fall substantially until investors believe inflation is moving lower on a lasting basis.
Government Borrowing Pressures Bonds
The Treasury outlook is also influenced by the amount of debt entering the market.
Large funding requirements mean investors must absorb substantial issuance. When demand fails to keep pace, bond prices may fall and yields rise.
Heavy issuance can keep long-term yields elevated even when the Fed pauses or eventually reduces short-term rates.
Trading Implications
The US 10-year yield retains a neutral-to-positive medium-term structure while remaining above 4.55%.
A confirmed break above 4.75% could expose 4.85% and 5.00%.
A move below 4.55% would weaken immediate upward momentum, while a sustained decline under 4.45% could shift attention toward 4.35%.
Higher inflation, stronger data, and weak Treasury demand would support yields. Falling oil prices and defensive bond buying would favor a decline.
Conclusion
The US 10-year Treasury yield is holding near 4.65% as investors weigh easing energy pressure against persistent inflation and borrowing concerns.
Resistance is positioned near 4.75%, 4.85%, and 5.00%. Support can be found around 4.55%, 4.45%, and 4.35%.
The recent rise is losing momentum, but a meaningful bearish reversal would require a sustained move below 4.55%.