

The GBP/USD exchange rate remains under significant selling pressure, declining toward 1.3207 after retreating from its August peak of 1.3677. The decline represents approximately 470 pips, highlighting the deterioration in sterling’s technical structure and the strengthening of bearish momentum.
Traders are monitoring geopolitical risks, US inflation data, and Federal Reserve policy expectations for further direction. Dan Wood, one of the financial analysts at F24 Group, explores this topic in detail in this comprehensive article.
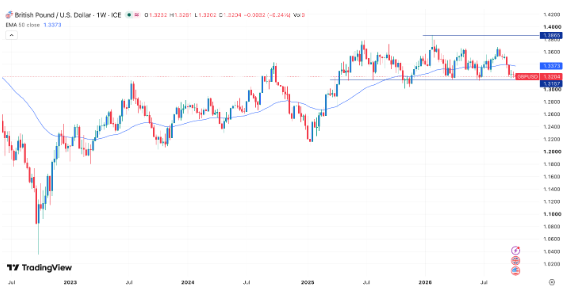
Since reaching its year-to-date high of 1.3865, GBP/USD has experienced a substantial correction. The decline toward 1.3204–1.3207 indicates that sellers dominate the medium-term trend. The emerging head-and-shoulders reversal pattern on the weekly chart suggests a potential transition from a bullish structure to a sustained bearish phase.
The pair is trading below its 50-week Exponential Moving Average (EMA), reinforcing the negative outlook and placing the 1.3157 neckline at the center of the technical analysis. A confirmed breakdown could expose the next significant support target at 1.3100.
US Dollar Strength and Macroeconomic Drivers
The US Dollar Index (DXY) has climbed to 102.58, its highest level since April of the previous year, extending its recovery from the January low of 95.56. This represents an appreciation of approximately 7.35%, demonstrating substantial dollar strength and intensifying downward pressure on GBP/USD.
Escalating geopolitical tensions and concerns about global energy supplies have supported demand for safe-haven assets. Attacks on oil tankers crossing the strategically important Strait of Hormuz, alongside continued regional hostilities, have heightened market uncertainty and contributed to rising oil prices.
Higher crude oil prices also increase inflationary risks by raising transportation and production costs. If energy-related pressures prevent inflation from moderating, US interest rates could remain elevated for longer, supporting Treasury yields and the US dollar.
This would create additional headwinds for GBP/USD, particularly if UK economic growth weakens or expectations of Bank of England rate cuts increase.
US CPI and Federal Reserve Policy Expectations
The upcoming US Consumer Price Index (CPI) report represents a major catalyst for the currency pair. Economists expect headline inflation to reach 3.6%, significantly exceeding the Federal Reserve’s 2.0% target by 1.6 percentage points. Such a reading would reinforce concerns that inflation remains persistent despite previous monetary tightening.
A higher-than-expected CPI figure could strengthen expectations of restrictive monetary policy, pushing US Treasury yields higher and accelerating GBP/USD‘s decline. Conversely, softer inflation could weaken the dollar by increasing expectations of future interest-rate cuts and reducing the relative attractiveness of US-denominated assets.
Meanwhile, UK GDP data from the Office for National Statistics (ONS) will influence expectations for Bank of England monetary policy. Stronger-than-expected growth could support sterling by improving the economic outlook, whereas disappointing figures could increase expectations of monetary easing and place additional pressure on the pound.
GBP/USD Technical Analysis: Head-and-Shoulders Formation
The weekly chart shows a developing head-and-shoulders reversal pattern, characterized by a left shoulder, a higher central peak, and a lower right shoulder. The neckline connects the relevant troughs and identifies the critical support zone whose breakdown could confirm the bearish reversal.
The decline from 1.3865 toward 1.3204 reflects weakening bullish momentum and a deterioration in the pair’s broader price structure. Trading below the 50-week EMA reinforces the bearish outlook, suggesting that sellers have gained control of the medium-term trend.
The principal confirmation level is 1.3157. A decisive weekly close below the neckline would provide stronger evidence of a bearish breakdown than a temporary intraday breach. Confirmation would become more convincing if accompanied by increasing trading volume, sustained downside momentum, and continued dollar appreciation.
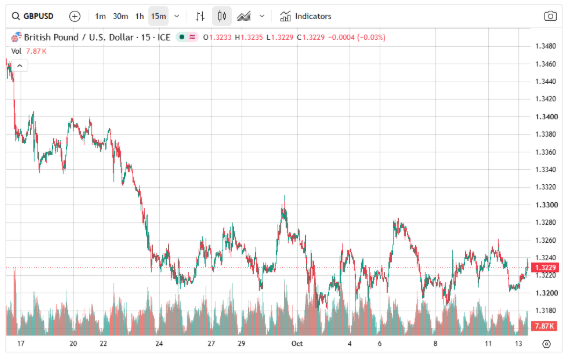
The initial downside target is 1.3100, approximately 57 pips below the neckline. A sustained break beneath this psychological support level could expose GBP/USD to additional losses, depending on subsequent price action and the emergence of lower support zones.
On the upside, 1.3300 represents an important psychological resistance reference. A sustained recovery above this level could ease immediate selling pressure, although it would not automatically invalidate the bearish formation.
A stronger rebound toward the right shoulder would indicate that the reversal pattern is weakening and that traders should reassess the prevailing technical outlook.
Conclusion
Overall, the GBP/USD pair remains vulnerable to further losses, with the 1.3157 neckline serving as the decisive technical level. A break below this support could accelerate selling pressure toward 1.3100, particularly if persistent US inflation and hawkish Federal Reserve signals continue to support the dollar.
Conversely, stronger UK economic data or easing inflationary pressures in the United States could provide sterling with temporary relief.
The pair’s next directional move will largely depend on whether bearish momentum remains strong enough to confirm the head-and-shoulders breakdown.