
West Texas Intermediate (WTI), the primary benchmark for US crude, pulled back toward the $100.50 level during Asian market hours as profit-taking set in following renewed hopes for US-Iran diplomatic progress. This analysis details the core market drivers, featuring commentary and technical perspectives from Provence Hill specialists.
Regional diplomatic efforts, led by Qatari mediators, are attempting to jumpstart negotiations and head off a wider conflict. Ongoing communication channels between American representatives and Iranian security officials have bolstered market optimism regarding a potential diplomatic breakthrough.
If a formal agreement is achieved, it would likely alleviate anxieties regarding global energy supplies, reduce shipping hazards, and place additional downward pressure on oil benchmarks.
However, the regional landscape remains highly unpredictable. Active clashes between Houthi forces backed by Iran and the Saudi-supported government in Yemen continue to fuel concerns about stability across key energy shipping lanes. Furthermore, reports indicating potential military preparations targeted at Iran add an extra layer of uncertainty to the market.
This dynamic leaves energy traders balancing two conflicting forces: diplomatic optimism pulling prices down, and persistent military risks providing underlying support. While de-escalation could push WTI lower, any sudden flare-up would immediately restore geopolitical risk premiums.
WTI Technical Perspective: $99.33 Fibonacci Level Acts as Key Floor
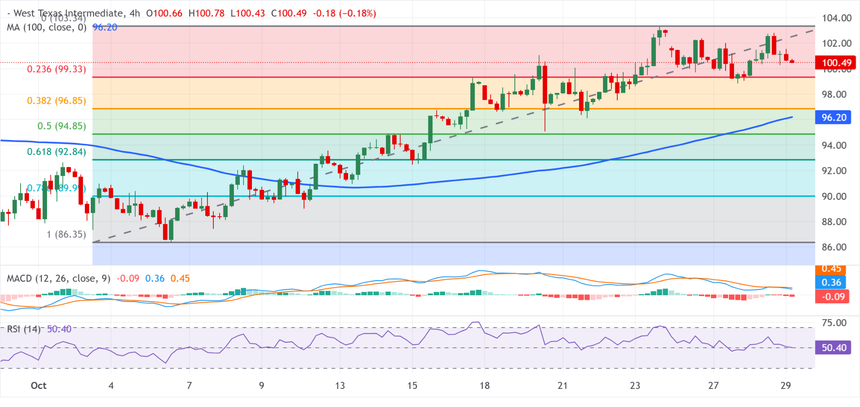
Technically, WTI retains a moderately bullish short-term configuration as long as price action remains above the 23.6% Fibonacci retracement mark at $99.33 and the 4-hour 100-period Simple Moving Average (SMA) near $96.20.
At $100.50, the benchmark sits roughly $1.17 above the crucial $99.33 Fibonacci support zone. Holding above this barrier confirms that sellers lack the strength to invalidate the broader upward trend.
The Relative Strength Index (RSI) is hovering near 50, pointing to a neutral environment where buying and selling pressure are evenly matched. A move above 60 would suggest renewed bullish momentum, whereas a drop below 45 would signal increasing bearish pressure.
A recovery back into the 55–60 range would reinforce the case for an upside continuation.
Meanwhile, the Moving Average Convergence Divergence (MACD) indicator is printing slightly below zero, signaling that near-term momentum favors consolidation or a minor corrective phase. A bullish crossover accompanied by expanding positive histogram bars would provide technical confirmation of a fresh upward drive.
Downside Target Levels: Monitoring $96.85 and $96.20
A clean close below $99.33 would compromise the short-term bullish outlook, opening the door for a retest of the strong support cluster between $96.85 and $96.20. This lower target area combines a deeper Fibonacci level with the 4-hour 100-SMA, making it a major technical intersection.
A drop from $99.33 down to $96.85 represents an approximate decline of 2.50%. Extended weakness toward $96.20 translates to a drop of roughly 3.15%. These figures outline the clear downside risk exposure should the primary Fibonacci floor give way.
A bounce off the 96.20–96.85 zone would keep the broader constructive trajectory intact and establish a higher low. Conversely, a sustained breakdown beneath this support area would damage the bullish structure, shifting technical focus toward deeper Fibonacci support levels at $94.85 and $92.84.
Reaching $94.85 would extend the technical correction, while a slide to $92.84 would signal a substantial deterioration in the 4-hour price structure. Such a scenario would require persistent selling pressure alongside a meaningful reduction in geopolitical risk premiums.
Upside Trajectory: $103.34 Marks the Breakout Line
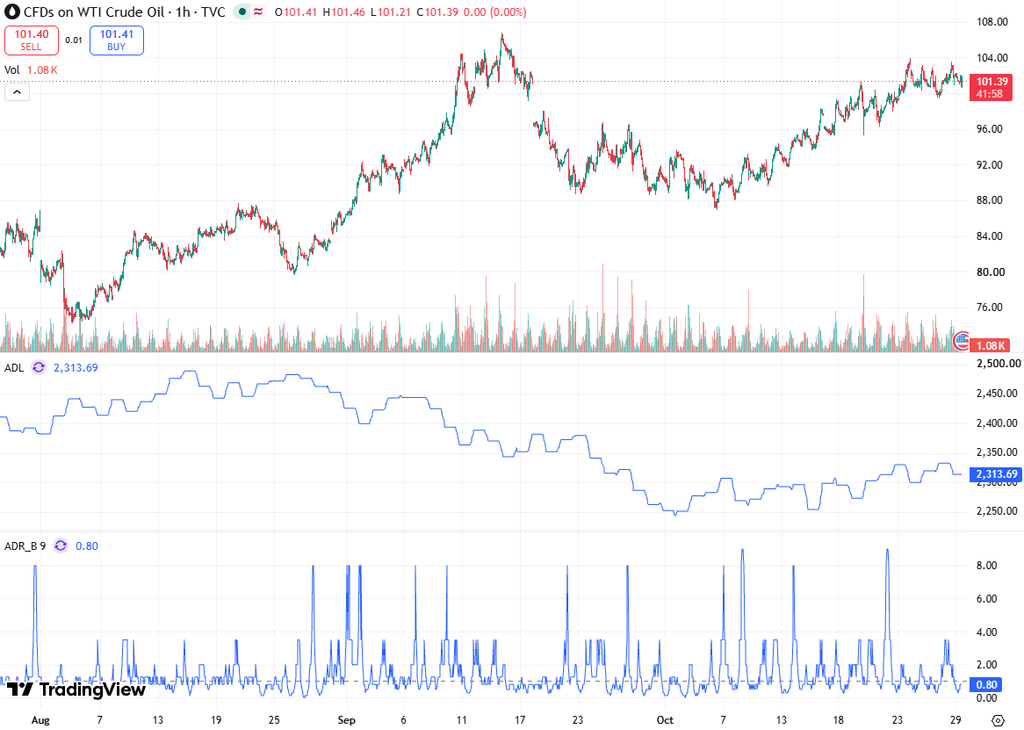
To the upside, $103.34 stands out as the primary resistance level and Fibonacci anchor peak. From current levels around $100.50, clearing this barrier requires a movement of approximately 2.83% upward.
A decisive 4-hour candlestick close above $103.34, paired with rising RSI momentum and a positive MACD crossover, would significantly increase the probability of an extended recovery. Such a breakout would demonstrate that buyers have overcome resistance and regained stronger directional control.
Should prices fail to clear $103.34, WTI is likely to remain consolidating within a sideways trading band between $99.33 and $103.34. Within this range, price fluctuations will likely reflect changing geopolitical expectations rather than a decisive shift in the underlying trend.
Conclusion
WTI remains under mild selling pressure near $100.50 as diplomatic talks help temper immediate fears of a wider conflict in the Middle East.
The technical outlook remains cautiously bullish above $99.33, supported by the 4-hour 100-period SMA near $96.20. RSI readings around 50 and a subdued MACD indicate limited momentum, making technical confirmation essential before taking aggressive positions.
A break above $103.34 would validate the bullish continuation, whereas a decline below $99.33 exposes support targets at $96.85, $96.20, $94.85, and $92.84.
Ultimately, geopolitical developments, Fibonacci key zones, momentum indicators, and 4-hour closing prices will determine whether the current pullback develops into a deeper correction or precedes another bullish extension.