
The US Dollar Index eased slightly on Wednesday but remained close to a one-month high as traders prepared for the Federal Reserve’s latest interest-rate decision. The index slipped around 0.15% to 101.27, while markets continued to price in another possible increase.
In this article, experts at Clear Markets Europe examine whether the dollar can regain 101.50 or whether a less hawkish Fed message could trigger a deeper pullback.
Fed Uncertainty Keeps the Dollar Supported
The Federal Reserve is widely expected to leave rates unchanged, but its statement and guidance will be closely examined.
Markets recently placed roughly a 30% probability on a 25-basis-point increase, reflecting concern that higher energy prices could slow progress on inflation.
The dollar remains supported because investors are not convinced that US monetary tightening has finished.
Even without an immediate hike, a warning that rates may stay elevated could support Treasury yields and dollar demand.
A softer message would have the opposite effect, particularly if policymakers focus more heavily on weaker growth.
The Short-Term Trend Remains Positive
The Dollar Index recently climbed to its strongest level in about a month before easing ahead of the announcement.
Price remains within a broader recovery structure while holding above the 101.00 region.
The advance suggests buyers continue to view pullbacks as opportunities while US yields remain elevated compared with several other major economies.
A sustained move below 101.00 would weaken that structure and suggest expectations of further tightening are fading.
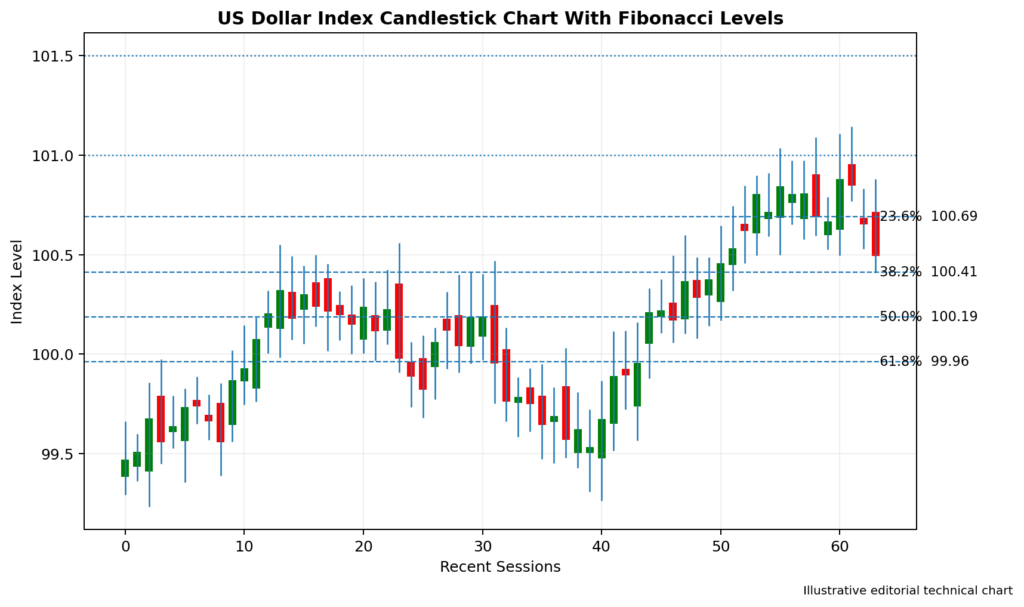
Image 1: US Dollar Index Candlestick Chart With Fibonacci Retracement Levels
Fibonacci Levels Define the Pullback
The first chart uses Fibonacci retracement levels to measure the latest recovery.
The 23.6% and 38.2% retracement areas provide the first important zones during a shallow decline.
Holding above them would suggest the pullback remains controlled and buyers are defending the wider advance.
A break beneath the 50% retracement level would signal that selling pressure is becoming more established.
A move below the 61.8% level would leave the recent bullish move increasingly vulnerable.
Resistance Builds Near 101.50
The first major resistance level is positioned around 101.50. A clear break above this area could expose 102.00, followed by 102.40.
A daily close above 102.00 would provide stronger confirmation that the dollar’s recovery is continuing.
Further gains would likely require a hawkish Fed message, stronger US data, or another rise in Treasury yields.
Support Begins Around 101.00
The first support area sits near 101.00. Holding above this level would preserve the immediate bullish structure and keep 101.50 within reach.
A break below 101.00 could expose 100.60, followed by the psychological 100.00 level.
A sustained move beneath 100.00 would weaken the medium-term outlook and suggest that dollar demand is fading.
Oil Prices Complicate the Policy Outlook
Geopolitical tensions have pushed oil prices higher again, renewing inflation concerns.
Brent crude recently rose more than 3% to around $87 per barrel as shipping risks increased uncertainty over Middle Eastern supply.
Higher energy costs can lift transportation and production expenses, making it harder for inflation to return to target.
Persistent oil strength could encourage the Fed to maintain a more restrictive stance.
That would normally support the dollar, although expensive energy could also weaken spending and growth.
The Euro Remains Under Pressure
The euro recovered slightly but remained close to a one-month low against the dollar. The difference between US and eurozone rate expectations continues to influence the pair.
A weaker euro would make it easier for the Dollar Index to challenge higher resistance.
Stronger eurozone data or a more hawkish ECB outlook could limit the dollar’s advance.
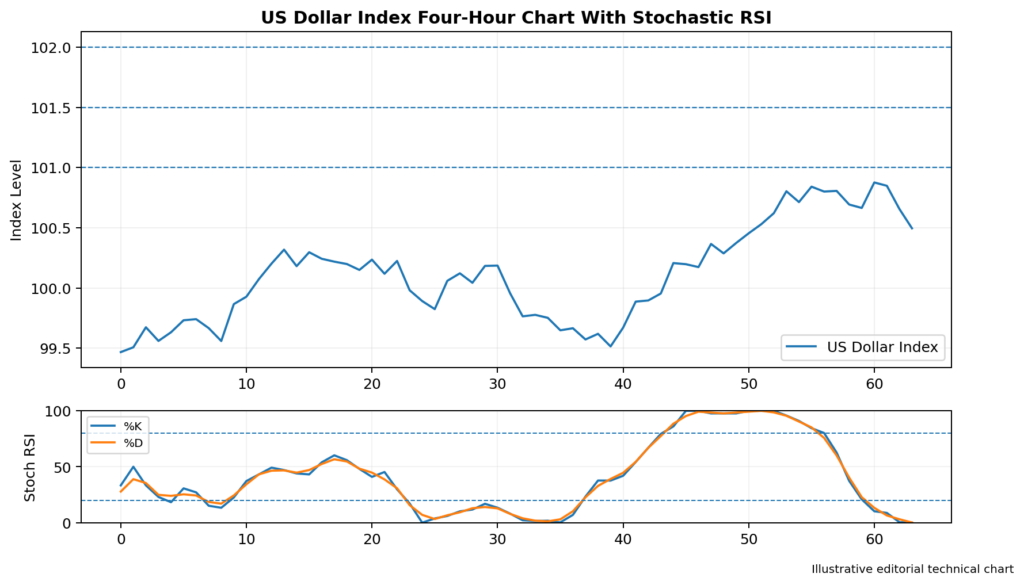
Image 2: US Dollar Index Four-Hour Chart With Stochastic RSI
Stochastic RSI Signals a Possible Pause
The indicator has moved away from overbought territory, suggesting the dollar’s recent surge has begun to cool.
This does not confirm a bearish reversal, but buyers may need fresh momentum before attempting another breakout.
A bullish crossover from the lower half of the indicator would support another move toward 101.50.
A drop below 20 would show stronger downside momentum, particularly if the index also loses 101.00.
Trading Implications
The Dollar Index retains a cautiously bullish outlook while trading above 101.00.
A confirmed break above 101.50 could expose 102.00 and 102.40.
A move below 101.00 would weaken immediate momentum, while a sustained break beneath 100.60 could shift attention toward 100.00.
A hawkish Fed statement and higher Treasury yields would support the upside case. Softer guidance would increase the risk of a deeper pullback.
Conclusion
The US Dollar Index remains near a one-month high as markets wait for clearer guidance from the Federal Reserve.
Resistance is positioned near 101.50, 102.00, and 102.40. Support can be found around 101.00, 100.60, and 100.00.
The broader technical structure still favors buyers, but the next move will depend on whether the Fed supports expectations of continued tight policy.