
The NFIB Small Business Optimism Index slipped to 95.3 in June 2026, down 0.6 points from May’s reading of 95.9, but the headline number dramatically understates the pricing pressure signal embedded in the survey’s granular detail.
The share of small businesses planning to raise prices over the next three months jumped seven points to 34%, the highest reading since July 2022.
A financial expert at Byronixel underlines how closely this data connects to what the stock market is currently pricing ahead of the Fed’s June 17 decision.
What the NFIB Actually Measures
The NFIB survey polls approximately 600 small business owners monthly across diverse US industries, capturing intentions and operating conditions that larger corporate surveys consistently miss.
Small businesses employ roughly 47% of the US private-sector workforce and generate more than 40% of GDP, making their pricing and hiring decisions a meaningful leading indicator of where inflation and employment data head in subsequent months.
When the share of small businesses planning to raise prices spikes seven points in a single month, it signals that cost pressures are building at the ground level of the economy before those increases appear in government CPI data.
The May business owner price increase reading of 36%, the highest since March 2023, adds a second data point confirming the trend is not a single-month anomaly worth dismissing.
These forward-looking readings did not appear in May’s CPI print, which came in at 4.2% year-over-year. If NFIB’s price intention data is an accurate predictor of near-term inflation, the June CPI report due in mid-July could surprise to the upside, extending the Fed’s higher-for-longer calculation further into 2026.
Which Stocks Feel This First
The sectors most directly exposed to small business pricing pressure are Consumer Staples, Consumer Discretionary, and Industrials. When small businesses raise prices, input cost pressure is already embedded in their supply chains, meaning their publicly traded suppliers are feeling the margin squeeze ahead of any CPI confirmation.
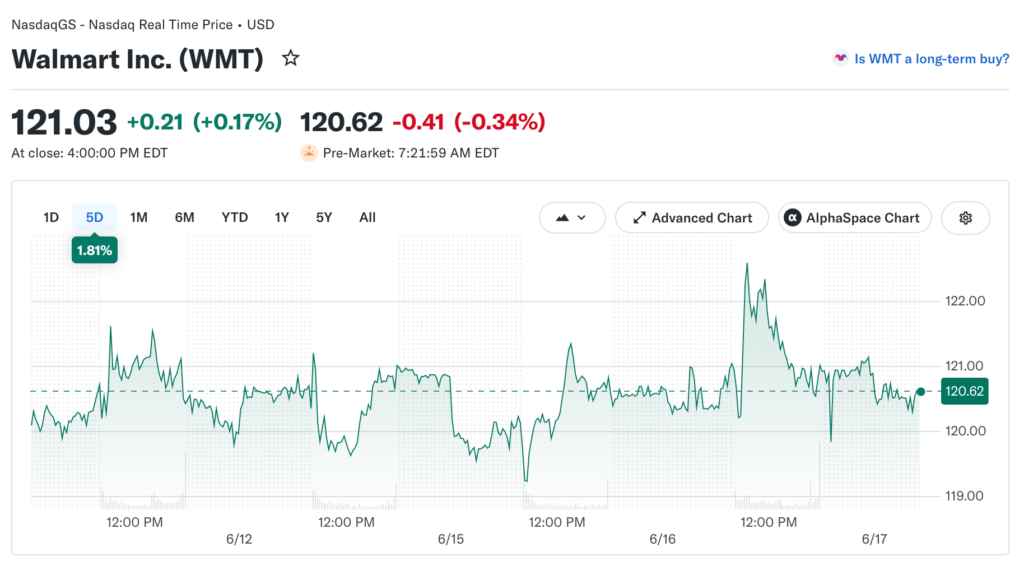
Walmart flagged margin drag from elevated energy costs earlier in 2026, and NFIB data suggests that margin pressure at the small business level has not peaked.
Retailers sourcing from small domestic suppliers face the dual burden of higher wholesale input costs and a consumer whose discretionary budget is already being tested by elevated borrowing costs and persistent food and energy inflation simultaneously.
Restaurant stocks are particularly exposed to this dynamic heading into Q3 2026. Labor costs represent the single largest operating expense for most food service operators and are directly tied to the wage expectations small business owners are already building into their current hiring plans. The NFIB survey showed hiring intentions remaining elevated despite the softness in the optimism reading.
The Rate Market Connection
The NFIB pricing data feeds directly into the Federal Reserve’s policy deliberations, which makes the June 17 timing of this analysis especially relevant. The Fed’s June 17 meeting is the first under new Chair Kevin Warsh, and the updated dot plot was widely expected to remove the easing bias the March projection had retained under the previous committee configuration.
NFIB data showing price increase intentions at 34% for the next three months and actual price increases at 36% in May gives Fed hawks on the FOMC committee exactly the evidence needed to argue against near-term accommodation.
A committee that debated the pace of cuts six months ago is now facing ground-level inflation data showing price pressure remains embedded across the small business sector.
Industrial Production and the Capacity Utilization Gap
Industrial production increased 0.1% in May 2026, with the April reading revised upward to 0.9% from a previously reported 0.7%. Capacity utilization came in at 76.2%, slightly below the consensus estimate of 76.3%, suggesting the manufacturing sector is running below full potential even as pricing pressure builds at the small business level simultaneously.
That combination of rising prices with below-capacity utilization points to cost-push inflation rather than demand-pull dynamics. Cost-push inflation is harder for the Fed to address through rate hikes alone because it originates from supply chain and input cost factors rather than excess consumer spending.
Industrial stocks like Caterpillar, Emerson Electric, and Parker Hannifin are worth monitoring for margin commentary in upcoming earnings to confirm whether the NFIB pricing signal is showing up at the large-cap level.
What Investors Should Track Before the Next CPI Print
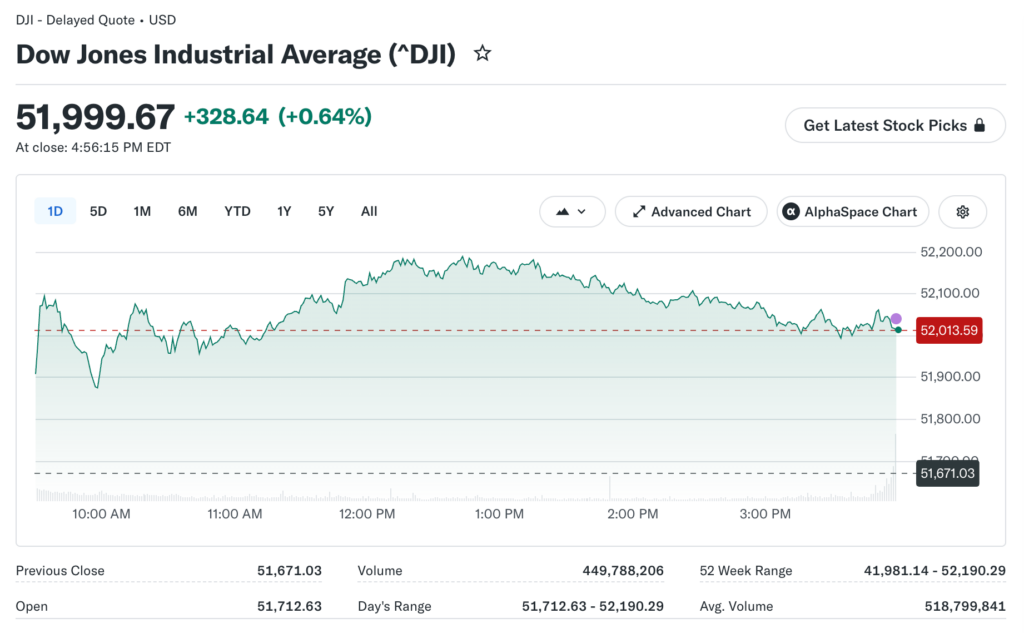
The Dow Jones Industrial Average gained 329 points on June 16, partly driven by rotation into industrial and value names that benefit from a cost-push environment where companies with genuine pricing power can pass costs through to end customers. That distinction separates stronger industrial stocks from weaker ones when inflation is supply-driven.
Investors monitoring the NFIB trend should treat the next survey reading, due in early July, as a key signal alongside the June CPI release. If price intention data continues rising while the headline optimism index stays flat or declines further, it signals stagflationary pressure building at the base of the economy that has not yet been fully priced into rate expectations or equity valuations for the second half of 2026.