
Precious metals markets encountered intense selling pressure after December gold futures breached critical technical support levels, confirming a bearish head-and-shoulders pattern across daily charts.
Analyzing technical breakdown mechanics, stop-loss order cascades, and shifting Treasury yield dynamics provides vital quantitative perspective on how institutional traders manage commodity exposure during market downturns.
Keeping tabs on sovereign bond yields, currency movements, and shifts in central bank monetary policy are essential for navigating precious metals allocations during major technical breakdowns.
Specialized market analysis provided by a currency expert at IUX Global shows that when gold fails to respond positively to favorable macroeconomic tailwinds, underlying physical and paper demand remains severely compromised.
Even as temporary price rebounds emerge during volatile trading sessions, breaking key multi-month support floors often accelerates institutional liquidation across global commodity desks.
Friday Technical Breakdown and Unresponsive Price Action
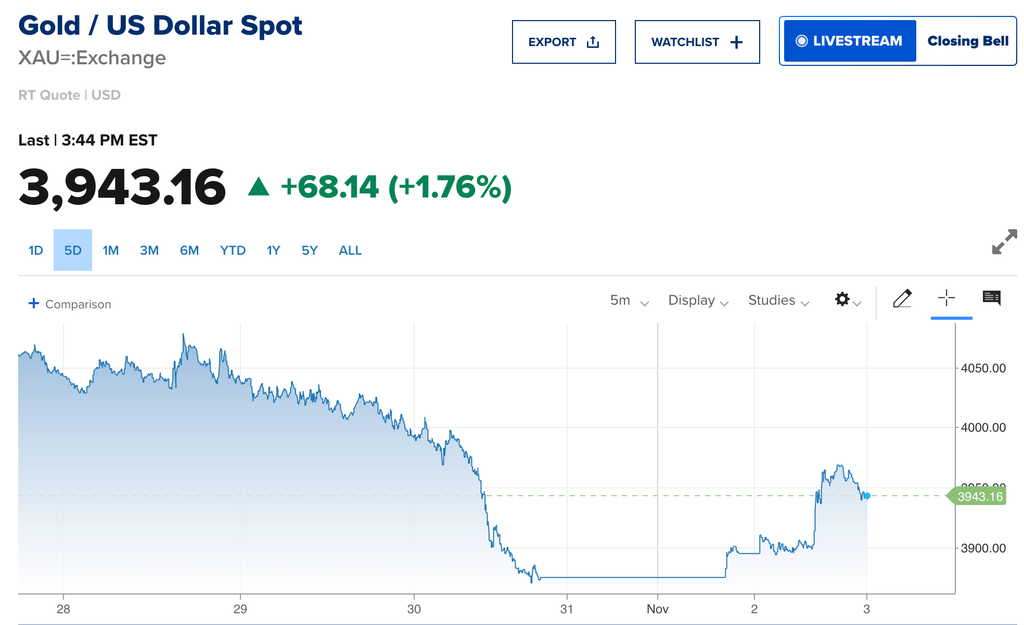
December gold futures experienced a sharp sell-off, dropping $132.50, or 3.3%, to close Friday at $3898.90 per ounce. The weekly close landed $21.10 below the established $3,920 technical target, after reaching an intraday low of $3,879.30, marking a fresh low for the current trading year.
The dramatic price decline occurred despite supportive macroeconomic news. 10-year Treasury yields fell from 4.98% to 4.92%, while the US Dollar Index declined for its third consecutive session.
Typically, lower bond yields and a weaker greenback lower opportunity costs and boost foreign buyer demand for non-yielding bullion, making gold’s failure to rally particularly bearish.
Structural Mechanics Driving Continuous Market Sell-Offs
Precious metals breakdowns often run without meaningful consolidation phases due to three reinforcing technical drivers. First, automated stop-loss sell orders cluster directly below obvious technical swing lows, such as the $3,989.10 level, or psychological key numbers like $3,900 per ounce. Breaching these floors triggers simultaneous automated selling into thin buying liquidity.
Second, algorithmic trend-following funds adjust positions based purely on price momentum, aggressively unwinding long positions and adding short exposure when new lows materialize. Third, rapid price drops trigger margin calls for leveraged buyers, forcing immediate liquidations that worsen price declines, mimicking the historical sharp breakdown observed during the spring of 2013.
Macroeconomic Factors and Short-Term Price Consolidation
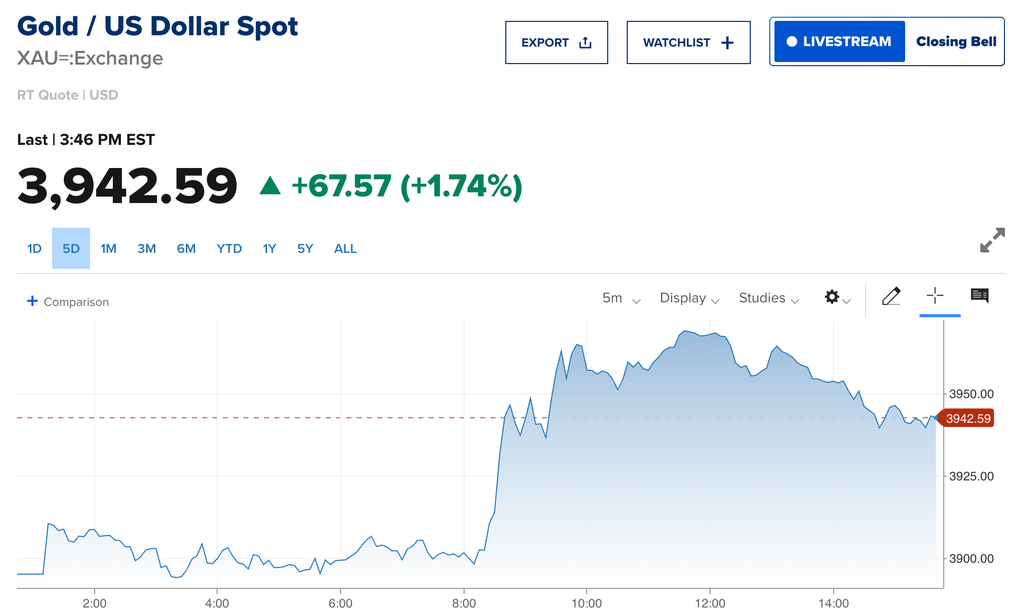
Following the initial rebound toward $3,970 per ounce, precious metals received modest temporary support from declining energy prices and broader currency adjustments. WTI crude oil prices dropped over 6% toward $97 per barrel, while global energy benchmarks like Brent crude traded near $117 per barrel following regional diplomatic updates.
Softer energy prices help ease immediate inflation pressures, indirectly influencing interest rate expectations. However, technical analysts view this price bounce as a brief 1-to-2-day consolidation phase rather than a structural trend reversal, expecting the broader downward trend toward lower downside targets to resume shortly.
Upcoming Economic Catalysts and Federal Reserve Policy Expectations
Financial markets face several high-impact economic events capable of driving interest rates, currency valuations, and precious metals prices. Key legislative elections command immediate focus, with market participants watching how election outcomes influence sovereign debt yields and fiscal spending projections.
Concurrently, upcoming labor market disclosures are expected to reflect 55,000 non-farm payroll additions alongside an unemployment rate of 4.2%. Interest rate futures monitored by the CME FedWatch tool indicate a 76% probability of a December rate hike following hawkish statements from central bank officials, presenting further headwinds for gold.
Downside Technical Targets and Secondary Mining Sector Impacts
With the initial target of $3,920 decisively breached, technical chart projections point toward a secondary downside objective near $3,500 per ounce. Once gold tests this lower support zone, analysts anticipate a potential technical recovery back toward $4,000, where former support will likely be tested as new resistance.
Precious metals mining equities experienced even greater downside pressure, with major mining indexes falling nearly twice as much as spot gold. Junior mining assets faced lowered target revisions as institutional investors adjusted risk models to account for narrower operating margins at lower bullion prices.
Tactical Risk Management for Commodities and Precious Metals Allocators
Strict stop-loss discipline and management of leverage ratios across futures accounts help institutional fund managers navigate the volatility of precious metals. Portfolio managers can safeguard capital during technical breakdowns by rebalancing commodity exposure. This allows them to wait for clear indications of price stabilisation.
Monitoring real interest rate differentials, physical exchange inventory flows, and technical support zones provides an objective framework for managing risk-adjusted returns across precious metals holdings.
Long-Term Outlook for Sovereign Reserves and Gold Market Equities
To successfully navigate commodity cycles that last several years, one must first determine the structural floors at which accumulation by central banks and physical demand for jewellery resume. In order to set favourable entry valuations, long-term investors can accumulate high-quality mining equities during significant technical sell-offs.
Maintaining a disciplined focus on physical market balance, production cost curves, and macroeconomic liquidity trends ensures that gold allocators build resilient portfolios capable of navigating volatile market environments.