
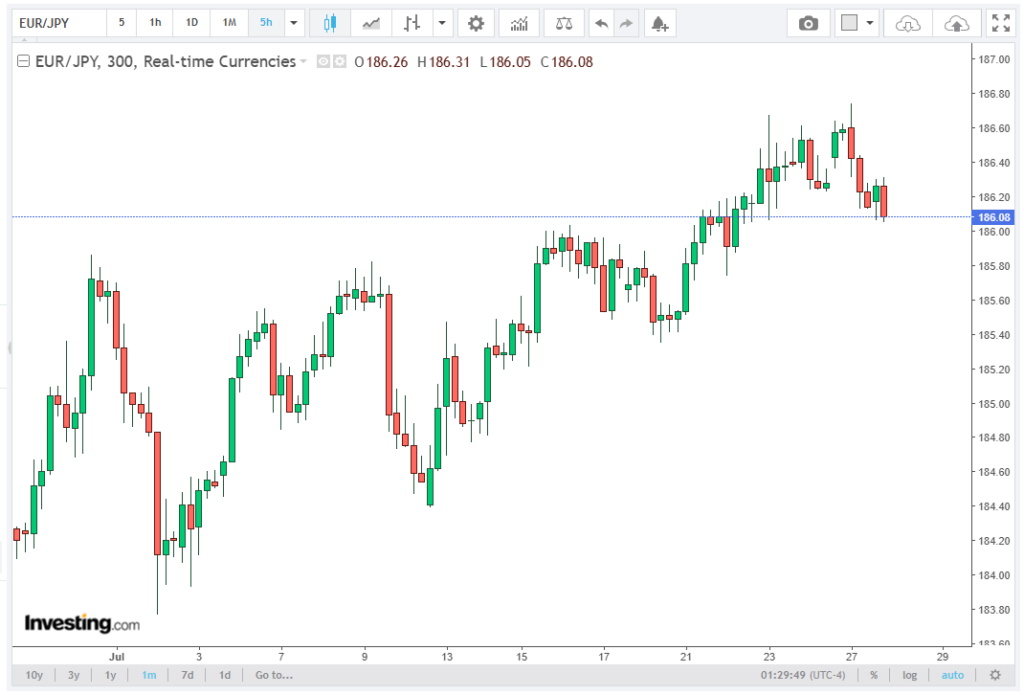
The EUR/JPY cross is trading around 186.20 during the Asian session on Tuesday, extending its recovery after two consecutive losing sessions. In the accompanying article, Rubinax’s brokers provide a detailed analysis of this topic.
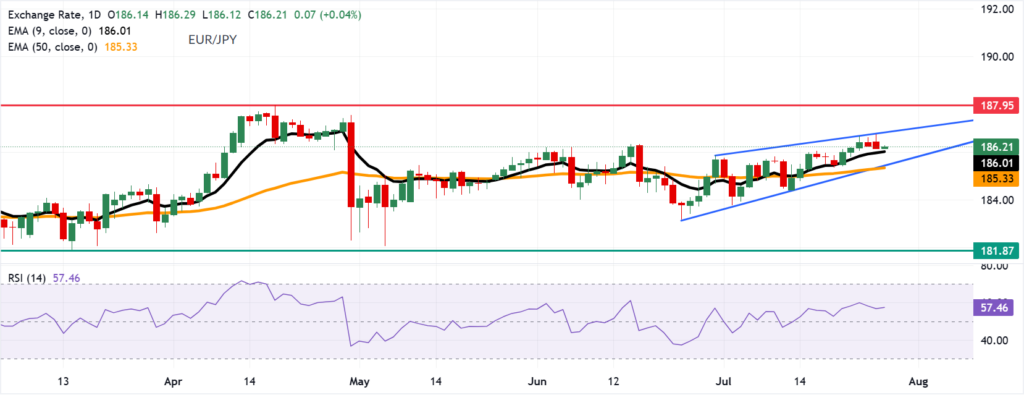
Despite the recent pullback, the cross continues to trade above the nine-day Exponential Moving Average (EMA) at 186.01 and the 50-day EMA at 185.33, confirming that the short-term and medium-term trend structures remain bullish.
Price action continues to register a sequence of higher highs and higher lows, while maintaining a position above both dynamic support indicators. As long as the exchange rate remains above the 186.01–185.33 support cluster, buyers retain control of the prevailing trend, although upside momentum has started to moderate.
Momentum Indicators Continue to Support Buyers
The 14-day Relative Strength Index (RSI) is currently positioned at 57.46, remaining comfortably above the neutral 50.00 threshold while staying well below the 70.00 overbought level. This configuration reflects moderate bullish momentum, indicating that buying pressure remains dominant and that there are no signs of excessive market positioning.
From a momentum perspective, the current RSI reading suggests there is still technical capacity for additional upside before conditions become overstretched. However, the relatively flat trajectory of the oscillator also suggests a slowdown in momentum relative to earlier advances, thereby increasing the importance of nearby resistance levels.
The alignment of price above both the nine-day EMA and the 50-day EMA, combined with an RSI above 50.00, continues to support the broader bullish outlook.
Rising Wedge Signals Increasing Reversal Risk
While the prevailing trend remains constructive, the daily chart continues to develop within a rising wedge formation, a pattern widely regarded as a bearish reversal structure. The narrowing price channel reflects weakening buying momentum despite continued gains, increasing the probability of a downside breakout if support fails.
The current technical configuration suggests that the market is approaching an important inflection point. A continuation toward the upper boundary of the wedge would preserve the bullish structure, whereas a decisive break below the lower boundary could trigger an acceleration in selling pressure.
186.90 Represents the Primary Resistance Level
The first upside objective is located near 186.90, corresponding with the upper boundary of the rising wedge. A sustained daily close above this resistance would invalidate the immediate bearish implications of the pattern and reinforce the broader uptrend.
A successful breakout above 186.90 would expose the all-time high at 187.95, recorded on April 17. A move through this historical resistance would confirm renewed bullish momentum and establish a pathway toward additional price discovery above previous record levels.
From a technical standpoint, 186.90 remains the most significant resistance level in the near term, with momentum confirmation required before a sustained extension toward 187.95 becomes likely.
Support Zone Between 186.01 and 185.33 Remains Critical
Initial support is provided by the nine-day EMA at 186.01, which continues to serve as the first dynamic support level. A break below this average would shift attention toward the lower boundary of the rising wedge near 185.50, followed closely by the 50-day EMA at 185.33.
The convergence of these technical indicators creates a high-probability support zone, where buyers may attempt to re-establish upward momentum. Holding above this area would preserve the current bullish market structure.
Break Below Support Could Accelerate Downside Momentum
Failure to defend the 185.50–185.33 confluence zone would likely confirm a bearish breakout from the rising wedge and trigger additional downside pressure.
In that scenario, the next technical objective is the five-month low at 181.87, recorded on March 16. A continuation of bearish momentum could subsequently expose the seven-month low at 180.81, representing the next major structural support on the daily timeframe.
A decline from the current market price of approximately 186.20 toward 181.87 would represent a correction of roughly 2.3%, while an extension to 180.81 would imply a decline of approximately 2.9%.
Technical Outlook
The overall technical outlook for EUR/JPY remains constructive while the cross continues to trade above the nine-day EMA at 186.01, the 50-day EMA at 185.33, and maintains an RSI reading of 57.46. These indicators continue to support a bullish bias, although the presence of the rising wedge pattern introduces an elevated probability of a technical reversal.
A sustained move above 186.90 would strengthen the bullish case and shift focus toward the record high of 187.95. Conversely, a breakdown below the 185.50–185.33 support region would invalidate the current bullish structure and increase the probability of a decline toward 181.87 and potentially 180.81.
Until either scenario materializes, EUR/JPY remains in a positive trend, with price action centered around the critical 186.00 technical area.