
Bitcoin (BTC) is demonstrating underlying strength after absorbing renewed selling pressure following the latest Federal Open Market Committee (FOMC) meeting. The cryptocurrency has declined approximately 1.5% over the past 24 hours, trading near $80,000.
Its ability to defend this important psychological and technical level suggests that the broader bullish market structure remains intact. Through its industry expertise, Aurelgate provides valuable context and insights throughout this article.
The Federal Reserve’s decision to maintain interest rates unchanged has temporarily reduced uncertainty surrounding monetary policy. Although inflation remains above market expectations, investors are increasingly shifting their attention toward institutional capital flows, technical indicators, and on-chain positioning.
From a market-structure perspective, $80,000 represents a critical demand zone. Buyers appear to be absorbing available supply, limiting the downside correction. Maintaining this support is essential because a sustained breakdown could invalidate the immediate bullish setup and expose lower liquidity levels.
Bitcoin therefore remains within its previously identified accumulation zone, with $82,000 representing the next important technical threshold.
Bitcoin ETF Inflows Signal Renewed Institutional Accumulation
The institutional investment landscape is providing a significant bullish catalyst. Spot Bitcoin ETFs have recorded three consecutive days of positive net inflows, indicating that institutional demand remains relatively strong despite recent price weakness.
Recent figures show approximately $423 million in ETF inflows during the week, bringing cumulative inflows to $728 million over eight sessions. Furthermore, six of the previous eight trading sessions registered positive net flows.
These figures are important because ETF inflows represent additional demand for Bitcoin exposure through regulated investment vehicles. Sustained capital allocations can increase spot-market buying pressure, particularly when exchange liquidity declines and investors transfer BTC into longer-term custody.
Positive ETF flows during a market correction can indicate that institutional participants are accumulating rather than distributing their positions. This strengthens the bullish case for a recovery toward $85,000, provided institutional demand remains consistent and buying activity continues across spot markets.
Weekly RSI and 200-Week EMA Support the Bullish Outlook
Bitcoin’s weekly technical structure presents several encouraging signals. The Relative Strength Index (RSI) previously dropped below 30, entering oversold territory for the first time since 2022.
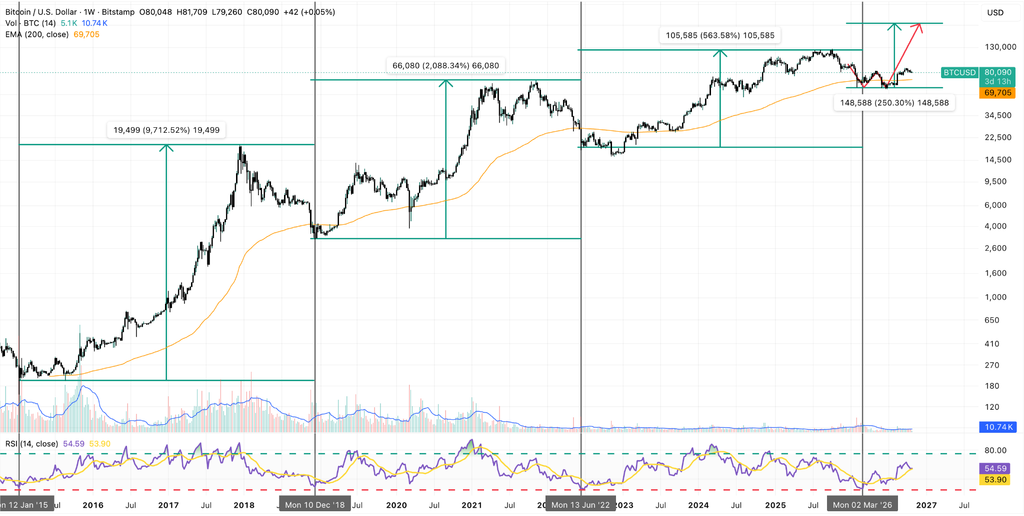
A weekly RSI reading below 30 generally indicates significant downside momentum and potential selling exhaustion. Its subsequent recovery suggests that bearish momentum is weakening, potentially creating conditions for a broader bullish reversal.
Another important technical reference is the 200-week exponential moving average (EMA). Historically, temporary movements below this long-term trend indicator have sometimes coincided with liquidity sweeps, followed by substantial price recoveries.
This market behavior involves leveraged liquidations, triggered stop-loss orders, and the absorption of available liquidity by larger buyers before a potential reversal. These movements can create favorable entry conditions for investors positioning around long-term support levels.
Based on the current weekly structure, $94,000 represents a potential medium-term upside target. A recovery from $80,000 to $94,000 would translate into approximately 17.5% price appreciation, assuming the current support structure remains intact.
Bitcoin Price Prediction: $82K Breakout Opens the Door to $85K
The four-hour chart identifies $82,000 as the immediate resistance level Bitcoin must overcome to confirm a short-term trend reversal.
A sustained breakout above this threshold would indicate that buyers are regaining control of the local market structure. Confirmation should ideally include increasing spot trading volume, improving momentum indicators, and a successful retest of $82,000 as support.
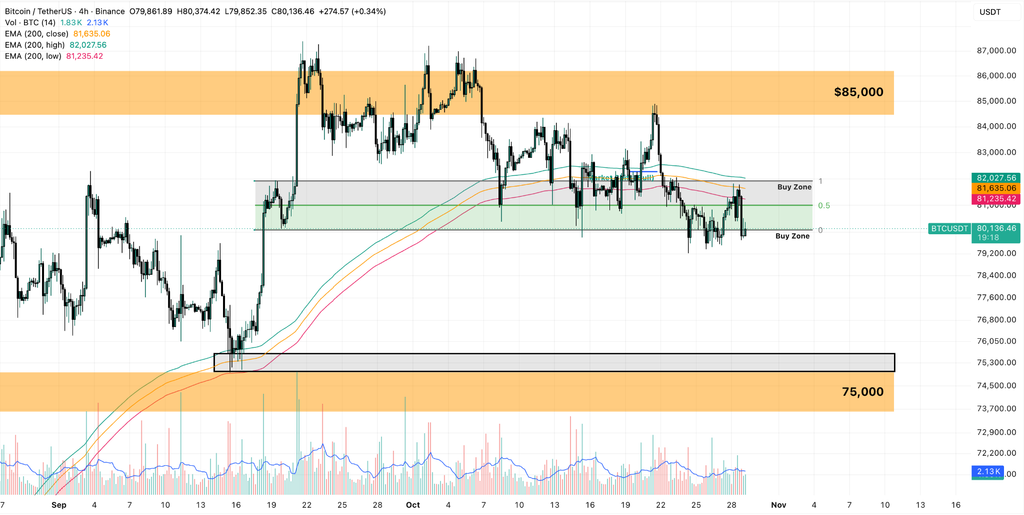
Following a confirmed breakout, the first significant upside objective is $85,000, representing approximately 3.75% upside from $82,000.
The next resistance area stands near $87,000, equivalent to approximately 8.75% upside from $80,000. Breaking above this region could accelerate bullish momentum and establish a pathway toward the broader $94,000 resistance target.
The immediate support structure remains concentrated around $80,000. A sustained breakdown could weaken the bullish setup, trigger additional liquidations, and increase the probability of a deeper retracement.
Traders should also monitor derivatives positioning, open interest, funding rates, and spot cumulative volume delta (CVD) to determine whether an upside breakout is supported by genuine spot demand rather than excessive leveraged speculation.
Conclusion: BTC Accumulation Could Fuel the Next Rally
Bitcoin’s ability to defend $80,000, alongside three consecutive days of positive ETF inflows and approximately 90,000 BTC in whale accumulation, provides encouraging evidence of persistent demand. The weekly RSI recovery and interaction with the 200-week EMA further support a potential bullish reversal.
The immediate requirement is a decisive breakout above $82,000, potentially opening the way toward $85,000 and $87,000. If institutional demand strengthens, ETF inflows remain positive, and market momentum accelerates, $94,000 becomes a credible medium-term price target.
The primary risk remains a breakdown below $80,000, which would weaken the accumulation thesis and potentially delay the recovery. Overall, the combination of institutional flows, whale positioning, improving momentum, and favorable technical indicators supports a cautiously bullish Bitcoin outlook.