
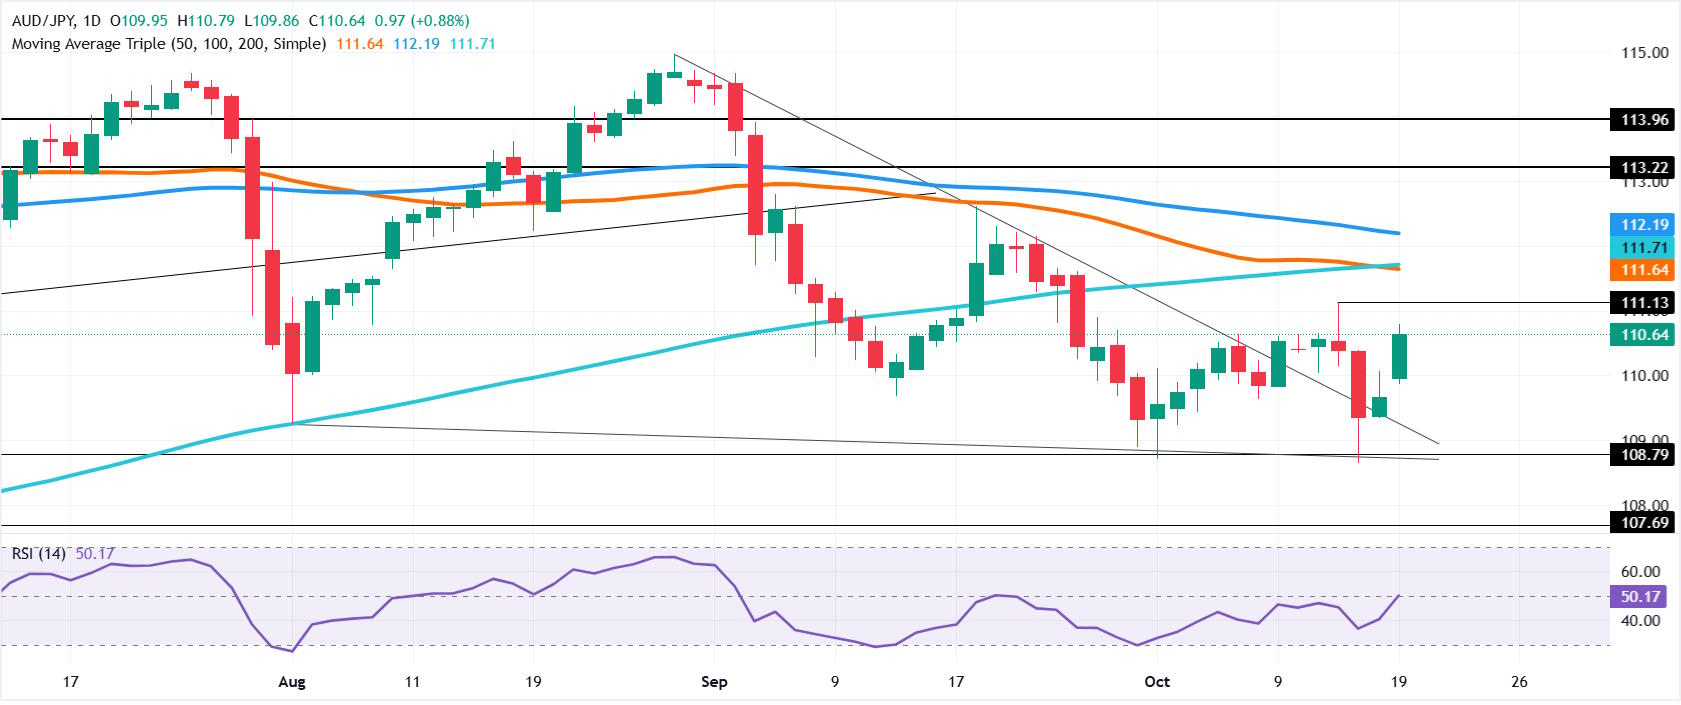
The AUD/JPY cross advances 0.88% to 110.64, strengthening its short-term bullish structure after rebounding from an intraday low of 109.86. The recovery places price action above the upper resistance trendline of a falling wedge pattern, a technical formation frequently associated with declining bearish momentum and a potential bullish reversal.
Risance’s expert brokers discuss the key aspects of this topic in the article.
The breakout suggests that buyers are gaining control, with the pair now positioned to challenge successive resistance levels at 111.13, 111.64–111.71, and 112.00. A sustained move above these barriers would strengthen the probability of an extended recovery toward the 100-day simple moving average (SMA) at 112.19.
Falling Wedge Breakout Strengthens Bullish Momentum
The falling wedge develops as price forms lower highs and lower lows within converging descending trendlines. The narrowing structure indicates that the range of price fluctuations is contracting, potentially reflecting diminishing selling pressure.
A break above the upper trendline provides a bullish signal, particularly when followed by sustained buying and higher closing prices.
For AUD/JPY, the recovery from 109.86 to 110.64 represents an advance of approximately 78 pips, demonstrating a meaningful intraday rebound. The pair’s ability to remain above wedge resistance is now a critical factor in determining whether the breakout can generate additional upside momentum.
Initial Resistance at 111.13
The first upside objective stands at 111.13, a previously established daily high. From the current price of 110.64, reaching this level would represent an advance of approximately 49 pips, or 0.44%.
A decisive break above 111.13 would establish a higher short-term price threshold and expose the next resistance cluster. A rejection at this level could produce temporary consolidation, with traders assessing whether buying pressure remains sufficient to sustain the breakout.
The immediate bullish scenario remains valid while price holds above the broken wedge resistance and maintains support around 110.00. A sustained move above 111.13 would improve the technical outlook and shift attention toward the 111.64–111.71 zone.
SMA Confluence at 111.64–111.71 Defines the Next Barrier
The 111.64–111.71 resistance zone represents a significant technical hurdle, containing both the 50-day and 200-day SMAs. Their convergence creates a potential supply area where trend-following strategies and profit-taking may influence price action.
From 110.64, the lower boundary at 111.64 is approximately 100 pips higher, while 111.71 represents a 107-pip advance. Clearing this zone would signal sufficient bullish momentum to overcome broader dynamic resistance.
A sustained close above 111.71 would strengthen continuation prospects toward 112.00. Failure to break through the moving-average cluster could leave AUD/JPY vulnerable to a pullback toward 111.13 or psychological support at 110.00.
112.00 Breakout Exposes the 100-Day SMA at 112.19
The 112.00 psychological threshold is the principal upside objective following a confirmed break above the moving-average confluence. Round-number resistance can attract concentrated order flow, making the area a potential point of increased volatility and profit-taking.
A move from 110.64 to 112.00 would represent approximately 136 pips, equivalent to a gain of around 1.23%. A decisive break above 112.00 would expose the 100-day SMA at 112.19, approximately 155 pips above the current price.
The 112.19 moving average represents the next technical reference for evaluating whether the recovery can extend beyond the initial breakout. A sustained move above this level would strengthen the broader recovery structure, while rejection around 112.00–112.19 could trigger consolidation.
Downside Levels: 110.00, 109.30 and 108.64
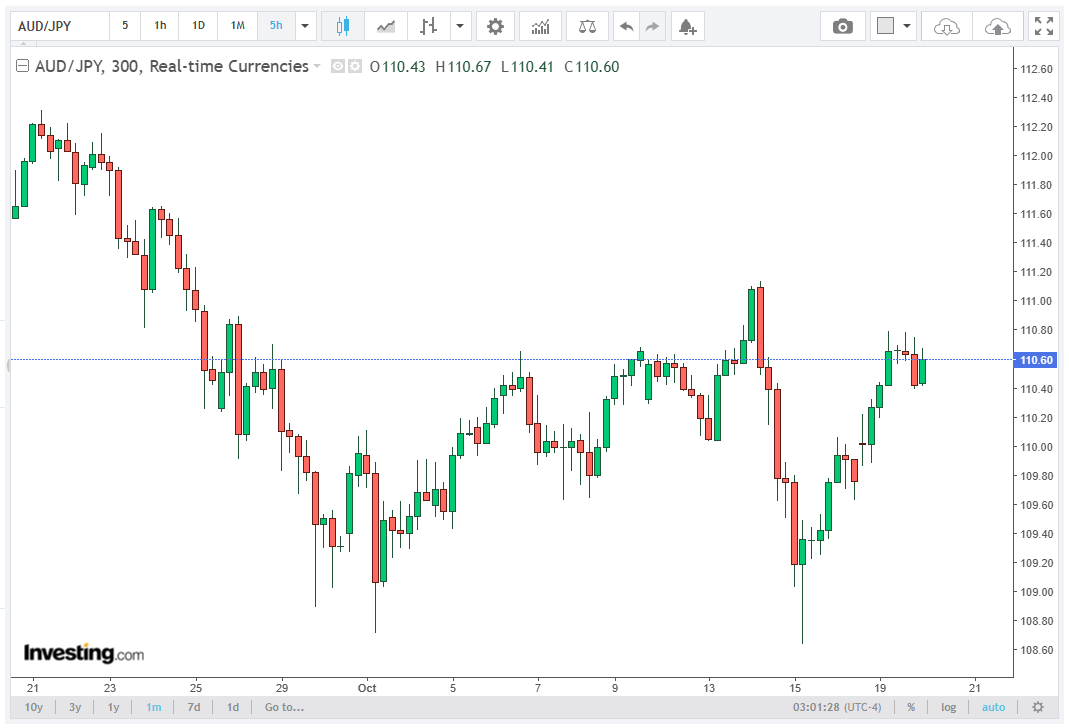
The primary near-term support is the 110.00 psychological level, located approximately 64 pips below 110.64. Holding above this threshold would help preserve the immediate bullish structure and keep the upside targets in focus.
A decisive break below 110.00 would weaken bullish momentum and expose the 109.00–109.30 support zone, where former resistance may act as support. A further decline below 109.00 would bring the previous low at 108.64 into focus, representing an additional deterioration in the technical outlook.
A move beneath 108.64 would significantly undermine the falling wedge breakout thesis and indicate that sellers have regained control of the near-term price structure.
Conclusion
The AUD/JPY technical outlook remains bullish following the confirmed move above falling wedge resistance. The initial target is 111.13, followed by the 111.64–111.71 SMA confluence. A sustained break above this resistance cluster would place 112.00 in focus, with the 100-day SMA at 112.19 providing the next upside objective.
On the downside, 110.00 is the immediate support threshold, followed by 109.00–109.30 and 108.64. Maintaining the breakout structure is essential for further gains, while a return below key support levels would increase the risk of a failed bullish reversal.