
The AUD/JPY cross is trading near 113.25 in early Wednesday European hours, reflecting a modest intraday decline after failing to sustain momentum above the mid-113.50 region. In this article, Nummixo brokers present a well-structured and straightforward explanation of the topic.
Despite the soft tone, the broader structure remains technically constructive, with price still holding above key medium-term support zones and maintaining its position within a defined bullish corrective channel.
The session’s price action is characterized by low directional conviction, as participants digest recent policy decisions from both the Bank of Japan (BoJ) and the Reserve Bank of Australia (RBA).
Volatility Structure and Momentum Conditions
From a volatility perspective, AUD/JPY is currently operating within a tightening range defined by declining short-term realized volatility. The daily range has compressed toward approximately 0.6–0.9%, below recent multi-week averages, suggesting market consolidation rather than trend expansion.
The 14-period RSI is currently fluctuating near 48–50, firmly within neutral territory. This reading confirms the absence of both overbought conditions (>70) and oversold conditions (<30), reinforcing the view that the market is in a mean-reverting phase rather than a directional impulse phase.
Momentum structure is further validated by price behavior around the Bollinger Band midline, currently situated near 113.58, where repeated rejections and failed breakout attempts have occurred. The compression between the mid-band and lower band highlights a coiling volatility structure, typically preceding either a breakout or an extended range continuation.
Trend Structure and Moving Averages
From a trend-following perspective, AUD/JPY retains a mildly bullish medium-term configuration as price remains above the 100-day Simple Moving Average (SMA), located near 112.00. This level continues to act as a structural trend floor, with historical buyers consistently defending this region on prior retracements.
The distance between spot price (113.25) and the 100-day SMA (~112.00) is approximately 125 pips, which indicates that the broader trend cushion remains intact despite short-term consolidation.
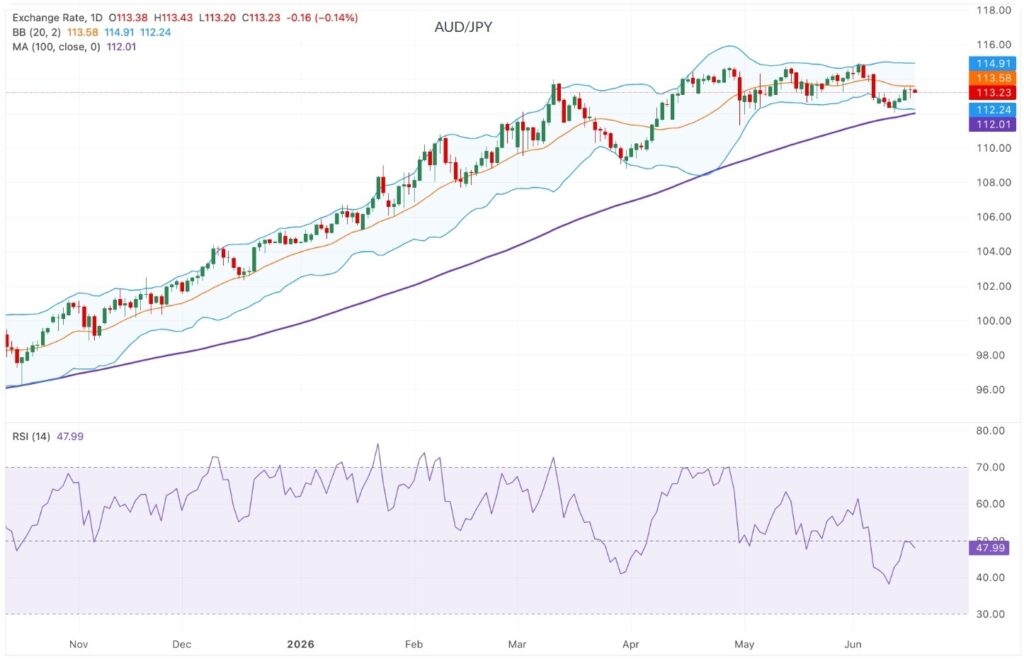
In addition, price is currently positioned in the upper half of the Bollinger Bands envelope, suggesting that while momentum is not expanding, the market is still biased toward trend preservation rather than reversal.
Key Technical Levels and Price Geometry
Immediate resistance is defined by the 113.58 level, which corresponds to the Bollinger midline and prior intraday rejection zone. A sustained break above this threshold, particularly on a daily close basis, would signal a potential shift in short-term momentum and reopen upside continuation scenarios.
Above this level, the next major resistance cluster is located near 114.40–114.90, aligning with the upper Bollinger Band boundary and previous swing highs. A breakout into this zone would represent a volatility expansion phase, potentially triggering algorithmic momentum flows and trend-following participation.
On the downside, the first critical support is located at 113.23, which is currently being tested intraday. A breakdown below this level would confirm a loss of microstructure support, exposing the pair to deeper retracement pressure.
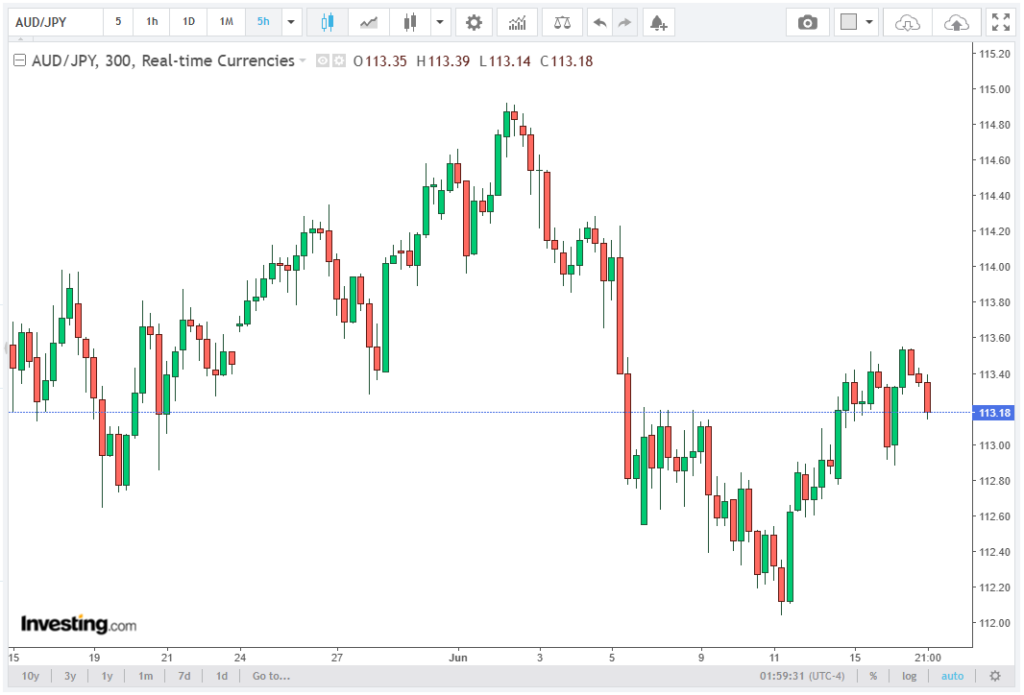
Below 113.23, the next support lies at 112.70, representing a minor liquidity zone formed during the previous consolidation leg. Further down, the 112.25 level aligns with the lower Bollinger Band, where statistical mean-reversion buying interest typically increases.
The most significant structural support remains at 112.00, anchored by the 100-day SMA, which acts as the primary trend invalidation threshold. A decisive break below this level would materially weaken the medium-term bullish structure and shift the regime toward a broader corrective phase.
Short-Term Technical Bias and Market Regime
The current technical regime can be classified as a bullish consolidation within a neutral momentum environment. This means that while the structural bias remains positive above 113.00, directional conviction is limited by RSI neutrality and compressed volatility.
Price behavior suggests that the market is oscillating between 113.23 support and 113.58 resistance, forming a short-term equilibrium band of approximately 35 pips, which is unusually tight relative to recent volatility standards.
Outlook and Scenario Mapping
As long as AUD/JPY remains above the 113.00 psychological threshold and the 112.00 structural SMA floor, the medium-term bias continues to favor a gradual bullish drift rather than a full reversal.
A sustained move above 113.58 would likely initiate a transition toward 114.50–114.90, confirming renewed upside momentum and ending the current consolidation phase.
Conversely, a break below 113.23, followed by acceptance under 112.70, would signal increasing bearish pressure and open the risk of a deeper correction toward 112.25 and 112.00, where trend integrity would be directly tested.
Until either boundary is decisively breached, the market is expected to remain in a low-volatility consolidation regime, with directional moves constrained and driven primarily by short-term flows rather than macro conviction.