
Cardano has been drifting lower for almost two weeks, but the latest sessions show signs that selling is losing intensity. The research team at Sylverix examines ADA, which is quoted near $0.1762, and explains which price areas will decide whether the pause becomes a recovery.
A Coin Still Locked Inside A Channel
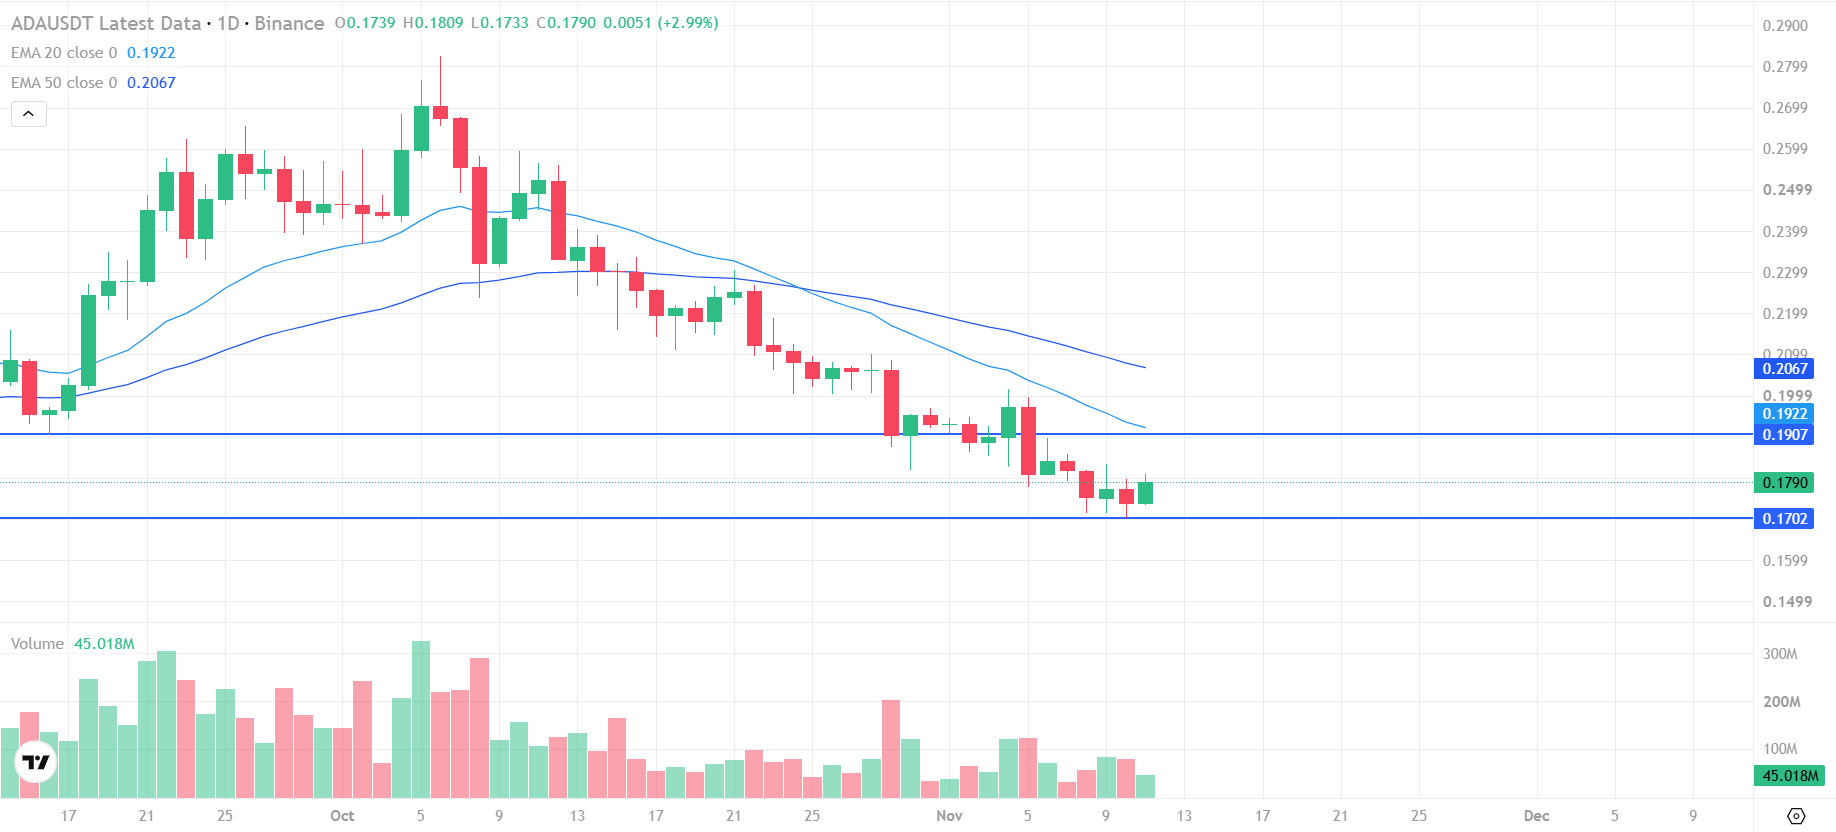
At the end of October, ADA traded close to $0.1924. Since then, it has lost roughly 8%, and every attempt to climb has stopped at a lower point than the one before. This sequence of lower highs and lower lows forms a descending channel, which is the main feature of the chart.
The latest day was quiet in terms of price, with a small drop of less than 1% and a range from $0.1712 to $0.1779. The market value stands at about $6.5 billion, a tiny fraction of the peak seen years ago, when a single coin cost $3.10.
How The Decline Unfolded
The weakness started on October 30, when a strong drop took the price under a support area near $0.2087. A rebound brought ADA to the upper edge of the channel around $0.21 on November 5, but sellers returned immediately, and a large decline on the following day erased most of the gain.
After that, the price slid again. A short dip toward $0.1712 happened on November 9, and the lowest point of the move, $0.1702, appeared on November 10. Since then, the pullbacks have been shallower, which is an early sign of stabilization.
Buyers Appear Near The Lows
Activity is the most interesting element today. Trading volume climbed by about 34%, to roughly $225 million, while the price changed very little. This combination usually means that one side is absorbing the orders of the other, and the evidence suggests that buyers were accumulating near the lows.
Liquidations point in the same direction. About $1.25 million of leveraged positions were closed by force, and roughly four of every five were bets on a rising price. Clearing out many of these trades can remove weak holders from the market and leave a cleaner base.
Momentum Is Improving Slowly
The Relative Strength Index is at about 45, slightly under the neutral level, but it has turned up from the low of November 9. That shows that selling momentum is fading, even if buyers have not taken control yet.
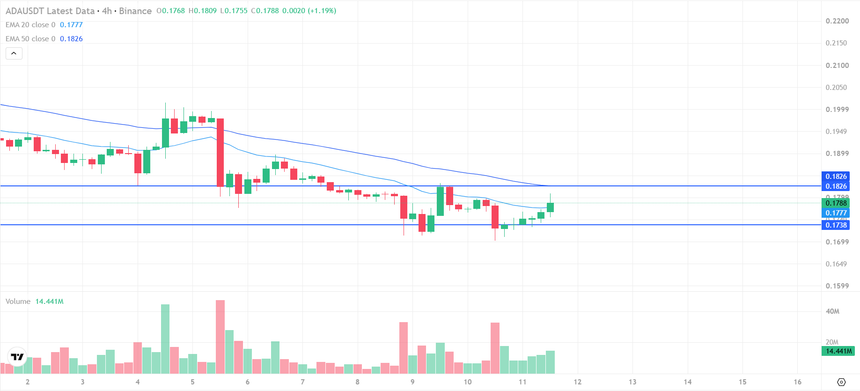
The price remains under the shorter exponential moving average, near $0.1775, and under the 50-period line near $0.1826. Longer averages near $0.1907 and $0.2027 are still above and pointing down. The chart therefore describes a pause within a downtrend, not a trend change, and the market needs to climb through each of these lines to change that view.
A Rebound Powered By Leverage
The structure of the move deserves caution. More money has entered through futures than through direct purchases, and the funding rate is slightly positive, which means that traders betting on a rise are paying a small fee to those betting on a fall. Open interest is about $399 million.
This kind of bounce depends heavily on borrowed money, so it can reverse quickly if the market turns. Sentiment also points to caution, with the fear and greed gauge near 30, a reading that signals fear. Extreme fear can sometimes mark the end of a decline, but it can also last for weeks.
Staking Keeps Supply Off The Market
On the network, more than half of the circulating supply, about 57%, is locked in staking, which reduces the amount of coins available for sale. Transaction counts rose to about 90,000 per day in the first part of the month and then cooled to roughly 23,000, so on-chain activity is quieter than it was during the sell-off.
Support And Resistance Levels
On the upside, the first barrier is the short average near $0.1775, followed by $0.1826, a level that acted as support earlier and now works as resistance. Further up come $0.1907 and $0.1982, with $0.2027 as a larger test.
On the downside, buyers first need to protect $0.1738. Under it lie $0.1712 and the November low of $0.1702, and a break of that zone would expose $0.1557.
What Traders Can Do
A neutral stance fits the price while ADA moves from $0.1738 up to $0.1826. Buyers may wait for a close above $0.1826 that holds, then look toward $0.1907 and $0.1982, with a stop-loss beneath $0.1738.
Sellers may prefer to wait for a close below $0.1702, targeting $0.1557, or for a failed attempt at $0.1826. Position size should stay modest, since news in the crypto market can move prices quickly, and a stop-loss should always be set before entering.
Conclusion
Cardano is pausing above $0.17 after a steady decline, with higher activity but no clear change of trend. The $0.1826 resistance and the $0.1702 support are the levels to follow.
Traders following Crypto strategies should watch trading volume, market sentiment and the reaction at these levels, since these factors are likely to guide the next move in ADA.