

The XAG/USD spot exchange rate has demonstrated a decisive upward expansion. The asset surged 1.25% to trade near the $67.00 handle during the Asian session. This upward vector is fundamentally anchored by a macro-driven compression in US Treasury Yields. It is also supported by a simultaneous devaluation of the US Dollar Index (DXY).
Discover Lucovox’s experts’ detailed analysis of this topic in this article.
As institutional capital reallocates away from sovereign debt instruments, the opportunity cost associated with holding physical commodities contracts significantly declines.
This provides an optimal mathematical framework for continued precious metals accumulation. Market participants are closely monitoring these shifts as global liquidity adjustments trigger heavy reallocations across multiple asset classes.
Fixed-Income Correlation and Currency Devaluation
The US Dollar Index (DXY) benchmarks the Greenback against a capitalization-weighted basket of six major fiat currencies. It has traded lower by 0.1% to settle near the 98.83 pivot following a partial intraday retracement.
Concurrently, benchmark 10-year US Treasury Yields contracted by 0.17% to print near 4.77%. This inverse mathematical relationship dictates that every basis point reduction in sovereign bond yields directly diminishes the real yield differential. Consequently, this augments the intrinsic valuation model for Silver by reducing the relative opportunity cost associated with holding a non-yielding precious metal.
Market participants are actively pricing in these yield contractions. This triggers systematic algorithmic buying across XAG/USD derivative contracts. Simultaneously, short-term leveraged positions are rapidly unwound to capture emerging risk-on momentum.
The combination of lower Treasury Yields and a weaker Greenback therefore provides a favorable macroeconomic backdrop for Silver. As institutional liquidity moves away from fixed-income instruments and toward alternative assets, precious metals can benefit from the changing relative-return structure.
Macroeconomic Data Vectors and Inflationary Modeling
Market attention is intensely focused on impending high-impact macroeconomic data releases. These include the Consumer Price Index (CPI) and the Producer Price Index (PPI). These empirical datasets will provide the quantitative basis for recalibrating Federal Reserve monetary policy expectations and forward-looking rate-cut probabilities.
Institutional economic models, such as those published by major multinational banks, project that core CPI will register a controlled monthly increment of 0.19%. This translates to an annualized rate of 2.3%.
This projection is structurally supported by the services sector, which continues to exhibit sticky price behavior. It is offset entirely by a projected negative contribution from core goods pricing.
Headline CPI is mathematically modeled to expand at 0.37% month-over-month and 3.4% year-over-year. This is primarily driven by externalized supply-side energy shocks and secondary food inflation pass-throughs.
Prior to the consumer-level data publication, the Producer Price Index (PPI) scheduled for release will offer critical intermediate wholesale insights into upstream cost pressures. This sets the directional tone for upcoming monetary committee deliberations.
Market participants will therefore evaluate the inflation data against existing Federal Reserve expectations, with deviations from projected figures potentially generating significant volatility across Treasury Yields, the DXY, and XAG/USD.
Advanced Technical Analysis and Momentum Oscillators
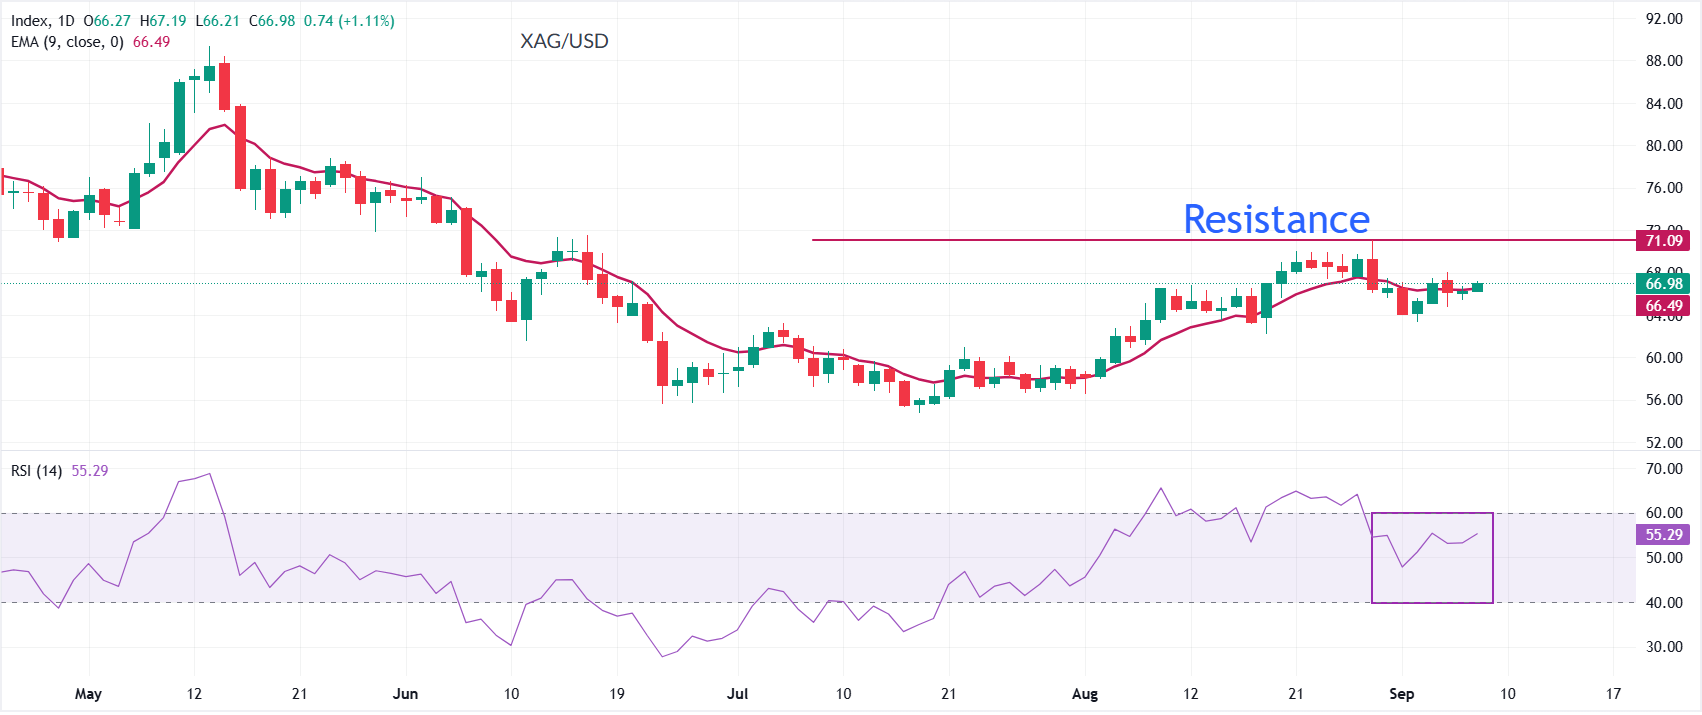
From a quantitative technical perspective, the XAG/USD daily chart exhibits a robust continuation pattern. Price action is anchored securely above the nine-day Exponential Moving Average (EMA) positioned at $66.49.
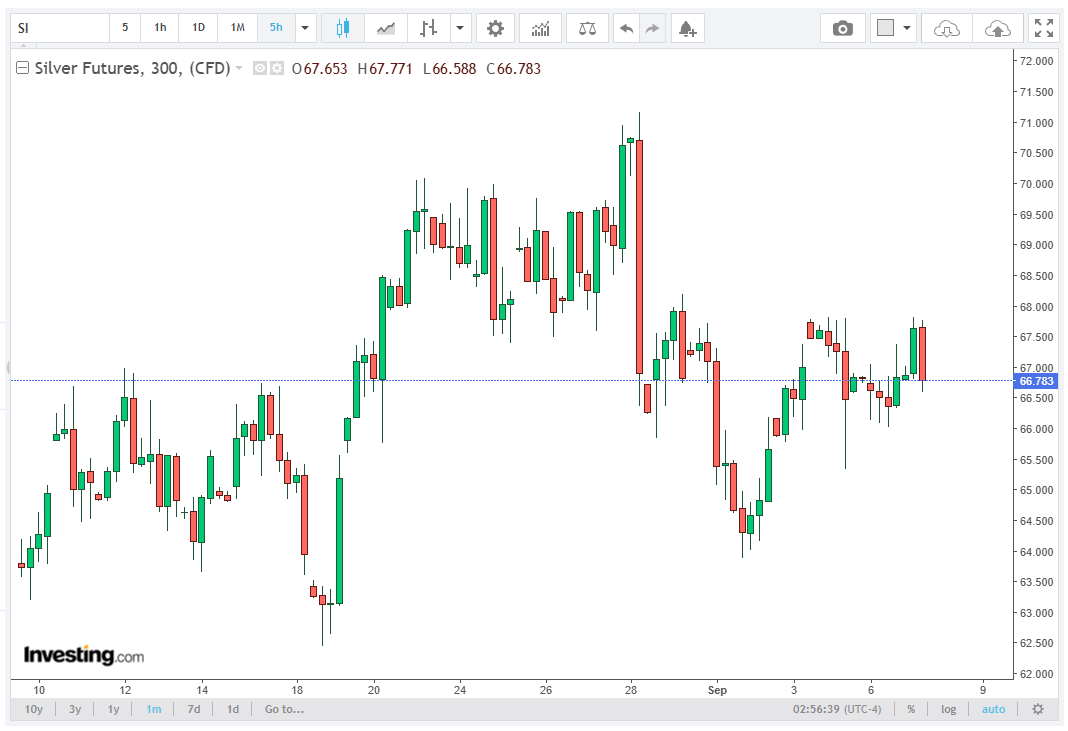
This technical positioning confirms that short-term price pullbacks are being aggressively absorbed by market liquidity providers. It prevents a premature bearish market structure breakdown and demonstrates that buyers continue to defend the prevailing upward trajectory.
Momentum oscillator analysis reveals a Relative Strength Index (RSI) print of 55. This indicates a sustained positive directional bias without breaching the overbought threshold of 70.
The RSI configuration therefore confirms that positive momentum remains active while leaving additional room for upward price development before the market reaches technically overbought conditions.
Downside risk management parameters dictate that immediate technical support coincides precisely with the nine-day EMA at $66.49. A confirmed daily candlestick close beneath this threshold would invalidate the primary bullish thesis.
Such a move would invite consolidation toward secondary support liquidity pools and could signal a broader deterioration in short-term momentum.
Conversely, on the upside, bulls must overcome historical resistance mapped at the August high of $71.12. Doing so will facilitate a breakout toward extended Fibonacci extension targets.
A sustained move above this resistance would strengthen the existing bullish structure and could trigger additional momentum-driven buying as market participants respond to the confirmed
Conclusion and Strategic Market Outlook
The convergence of contracting sovereign yields, a softening Greenback, and persistent structural demand establishes a resilient platform for Silver valuations moving forward.
While upcoming inflation prints and central bank policy decisions introduce localized volatility vectors, the underlying technical structure and macro correlations favor continued bullish engagement within defined risk parameters.
Sustained closes above critical moving averages will remain the primary determinant for institutional accumulation phases.
Market participants must navigate the evolving global economic landscape with disciplined risk controls as these macro trends mature.