
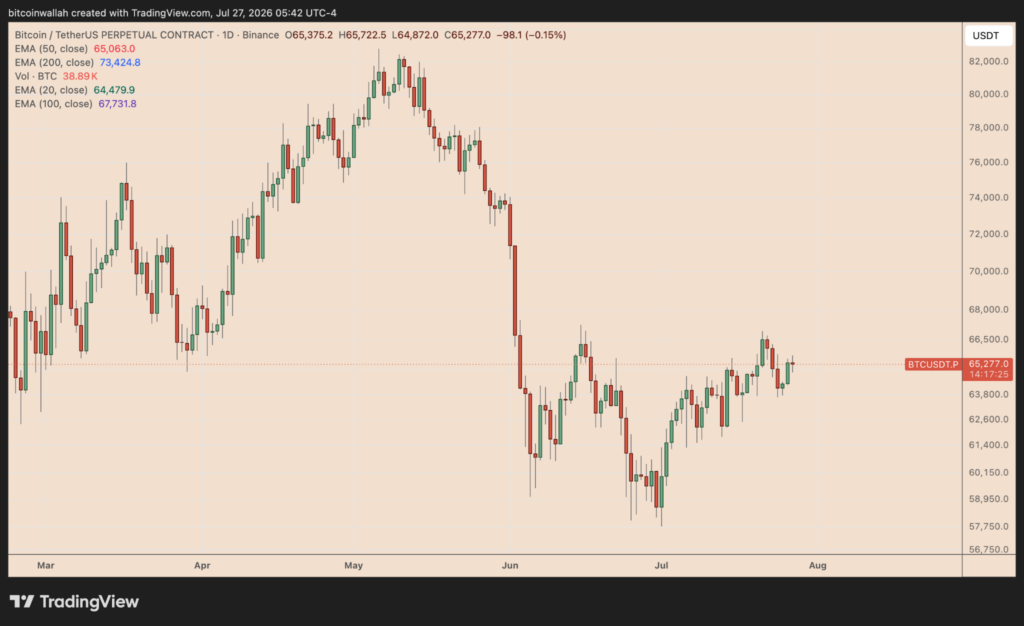
Bitcoin (BTC) recovered sharply during the weekend session, climbing above the critical $65,000 support zone as declining oil prices reduced market fears surrounding a potential inflation resurgence. BTC advanced more than 3% from its weekend low, reaching an intraday peak of approximately $65,722 before consolidating near the $65,000–$66,000 range.
The accompanying article sees Rubinax’s brokers delve into the details of this topic.
The rebound was driven by improving global risk sentiment after a pause in geopolitical tensions between major economies. The reaction across financial markets showed how strongly Bitcoin price action remains connected to changes in liquidity conditions, inflation expectations, and central bank policy forecasts.
Lower energy prices reduced concerns that a renewed supply shock could push inflation higher and force policymakers to maintain restrictive monetary conditions. For Bitcoin, this created a short-term environment where investors were more willing to increase exposure to high-beta assets.
Oil Collapse Reduces Inflation Pressure and Supports Risk Assets
The energy market experienced a significant reversal, with Brent crude oil falling more than 4% toward $92 per barrel while West Texas Intermediate (WTI) declined over 5% to approximately $84 per barrel.
The decline in crude prices improved expectations for future consumer price inflation, as energy costs represent a major component of global inflation trends. Lower oil prices can reduce pressure on bond yields, improve expectations for financial liquidity, and support demand for assets such as cryptocurrencies and equities.
Market pricing for monetary policy also shifted. The probability of a July interest-rate increase declined from approximately 37% to 30%, while expectations for a September 25 basis point hike remained elevated above 56%. This indicates that traders continue to price uncertainty into future Federal Reserve decisions despite the improvement in risk appetite.
BTC Technical Analysis: $65,600 EMA Is the Immediate Trigger
From a technical perspective, Bitcoin is testing a major short-term resistance level. The asset is currently trading below the 20-period exponential moving average (20-3D EMA) on the three-day chart, located near $65,600.
A decisive reclaim of the $65,600 EMA would strengthen the recovery structure and signal that buyers are regaining control of short-term momentum. The next technical target would be the 50-period three-day EMA, positioned around $70,400.
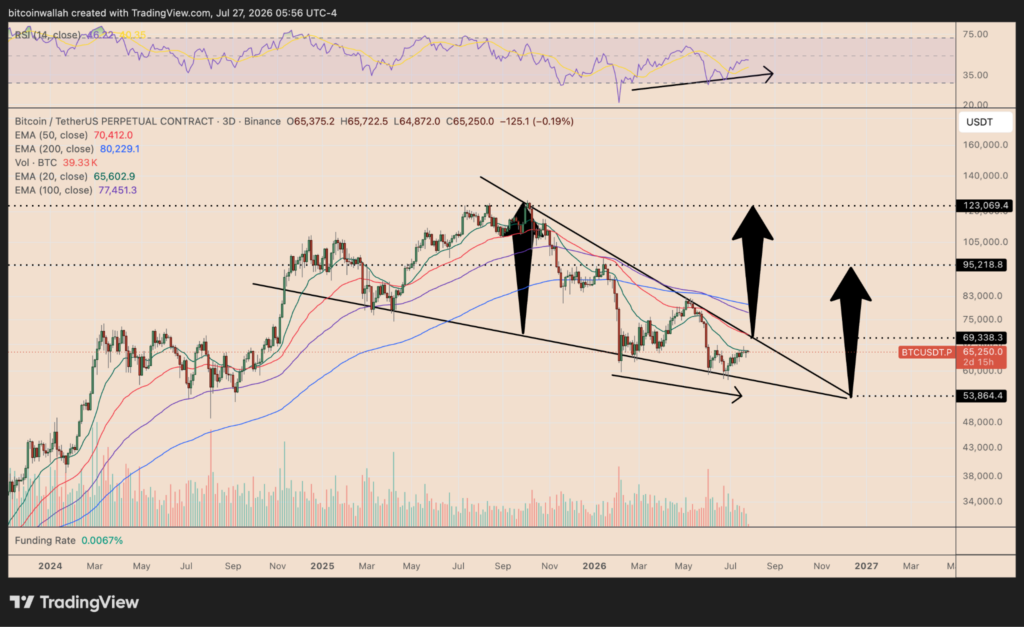
The $69,000–$70,500 resistance zone is especially important because it combines the 50-3D EMA, previous price congestion, and the upper boundary of a broader falling wedge formation.
A successful move above this region would increase the probability of a continuation toward $70,000, with late July and early August representing a potential timeframe for a breakout attempt.
Falling Wedge Breakout Creates Long-Term Upside Targets
Bitcoin’s current chart structure resembles a falling wedge pattern, which historically can act as a bullish reversal formation when price breaks above the declining resistance trendline.
A confirmed three-day close above the wedge’s upper boundary would provide technical confirmation of a breakout. The projected upside target depends on the breakout location because the wedge’s height decreases as the pattern approaches its apex.
If BTC breaks above resistance near $69,000, the measured move could produce an aggressive target near $123,000. This projection is calculated by applying the maximum height of the wedge structure to the breakout point.
A later breakout closer to the wedge apex around $54,000 would create a smaller but still significant upside objective near $95,000.
$54,000 Support Determines Whether Bulls Maintain Control
Despite the improving outlook, Bitcoin remains vulnerable if buyers fail to break above resistance. A rejection near the 20-3D EMA at $65,600 could keep BTC trapped inside the falling wedge and increase selling pressure.
The lower boundary of the wedge is expected to provide support near $54,000. This level represents the key technical defense for the current bullish setup.
A breakdown below $54,000 would invalidate the falling-wedge recovery scenario and suggest that the market structure has shifted back toward a bearish trend. Such a move could expose Bitcoin to deeper corrective targets and weaken expectations for a move toward $70,000 and higher.
Bitcoin Outlook: Breakout or Extended Consolidation
Bitcoin’s recovery above $65,000 has improved the short-term technical picture, supported by falling oil prices, reduced inflation fears, and a stronger appetite for risk assets.
The next major test remains the $65,600 EMA, followed by the $69,000–$70,500 resistance zone. A breakout above this area could activate the falling wedge pattern and create a pathway toward $95,000–$123,000 over a longer timeframe.
However, failure to reclaim key moving averages would keep Bitcoin inside its current consolidation structure, with $54,000 acting as the critical invalidation level.
The coming sessions will likely determine whether Bitcoin’s rebound becomes the beginning of a larger trend reversal or simply another temporary recovery within a broader consolidation phase.