
Ethereum (ETH) has become the strongest-performing asset among the top 10 cryptocurrencies by market capitalization over the past 30 days, delivering a 23% gain while outperforming competing altcoins.
The recent rally reflects improving market structure, rising spot demand, and increasing expectations that Ethereum may have established a significant cycle bottom. Rubinax’s brokers offer a comprehensive discussion of this topic in the accompanying article.
Ethereum’s momentum has accelerated as trading activity expands. 24-hour trading volume increased by 190%, reaching approximately $13 billion, equivalent to nearly 5% of ETH’s circulating market capitalization.
A sharp increase in volume following a technical breakout above key resistance typically indicates stronger participation from both institutional and retail investors.
The increase in activity has also triggered significant derivatives market volatility. Total short liquidations reached $239 million, while Ethereum-specific liquidations accounted for approximately $116 million, exceeding Bitcoin’s liquidation levels during the same period.
This imbalance suggests that a large number of bearish positions were forced to close, creating conditions for a potential short squeeze rally.
Macroeconomic Conditions Improve as Geopolitical Risk Declines
Ethereum’s recovery has developed during a period of elevated macroeconomic uncertainty. Recent reports of renewed U.S.-Iran negotiations have reduced some market concerns surrounding energy markets and geopolitical escalation.
Crude oil prices have declined from a recent peak near $94 per barrel to approximately $83 per barrel, indicating that investors are pricing in a lower probability of prolonged disruption.
Lower geopolitical risk can improve sentiment toward risk assets, including cryptocurrencies, by reducing pressure from inflation expectations and global market instability.
Ethereum MVRV Ratio Signals Potential Accumulation Phase
A key on-chain indicator, the Market Value to Realized Value (MVRV) Ratio, is displaying a pattern similar to Ethereum’s previous market bottom formation.
The MVRV Ratio compares Ethereum’s current market capitalization with its realized capitalization, which calculates network value based on the price at which each ETH token was last transferred.
When the ratio falls into deeply negative territory, it often indicates that a large portion of holders are underwater, historically creating potential accumulation zones.
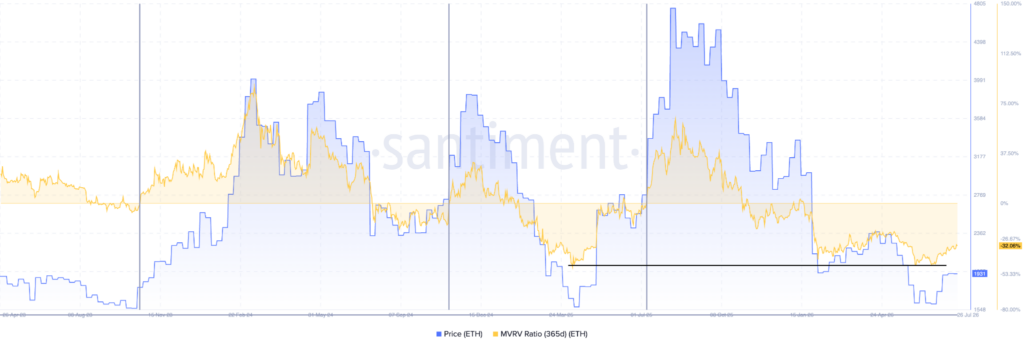
Recently, Ethereum’s MVRV Ratio formed a triple-bottom structure near the same levels recorded in March 2025, when ETH reached a low around $1,400. The repeated reaction from this valuation zone suggests that long-term investors may be increasing exposure as selling pressure weakens.
Historically, a move by the MVRV Ratio above the zero line has coincided with the early stages of major bullish trends. Although the indicator remains below this threshold, its stabilization may represent an early signal that Ethereum is transitioning from a bearish valuation phase into a potential recovery cycle.
ETH Technical Analysis Points Toward $2,200 Resistance
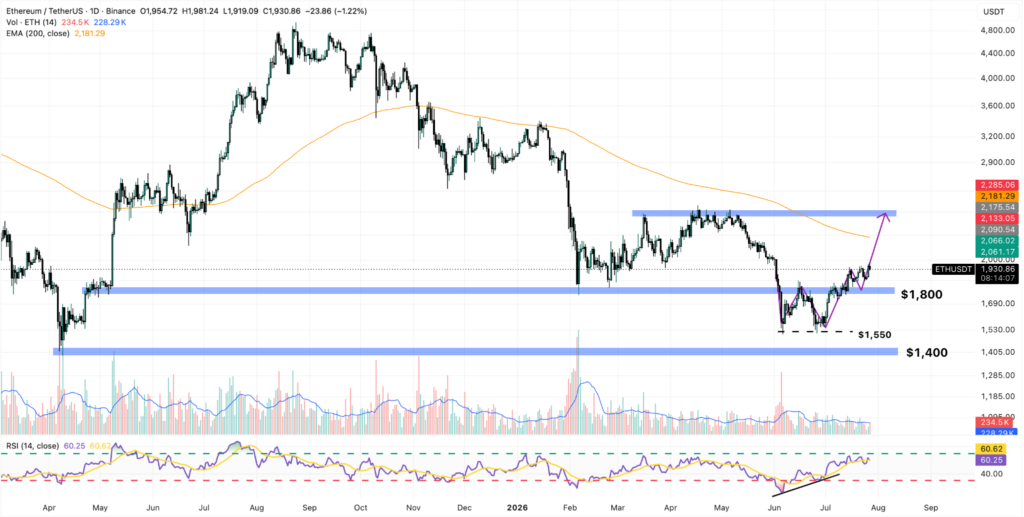
Ethereum’s daily chart is showing several bullish technical signals. ETH recently completed a W-shaped reversal pattern after breaking above the $1,800 resistance level, confirming a shift in short-term momentum.
The asset also established a double-bottom formation near $1,550, highlighting strong demand at that price region. The formation suggests that buyers were willing to defend lower levels, creating a technical base for further upside.
The next major resistance target is located around $2,200, where Ethereum’s 200-day exponential moving average (EMA) currently sits. The 200-day EMA is a critical long-term trend indicator used by institutional traders to evaluate whether an asset is trading above or below its broader market trend.
A successful move toward $2,200 would represent a significant recovery from the March lows near $1,400, marking a potential gain of approximately 57% from that bottom zone.
Break Above $2,000 Could Trigger Rapid Move Toward $2,400
The $2,000 psychological resistance level remains the most important short-term barrier for Ethereum. A confirmed breakout above this area could trigger additional buying pressure as leveraged traders adjust their positions.
A similar market dynamic occurred during previous Ethereum rallies, where resistance breaks caused aggressive short covering and rapid price expansion. If ETH clears $2,000 with strong volume, the next technical target would likely become the $2,400 resistance zone.
However, the reaction around the 200-day EMA near $2,200 will determine whether Ethereum enters a sustained uptrend or faces renewed selling pressure. A rejection at this level could result in consolidation, while a breakout could confirm a broader bullish reversal.
Ethereum Outlook Remains Technically Bullish
Ethereum currently benefits from a combination of improving on-chain fundamentals, stronger market liquidity, and favorable technical indicators. The 23% monthly gain, 190% volume expansion, declining short positions, and repeated MVRV Ratio bottom pattern all point toward improving market conditions.
While external risks remain, Ethereum’s current structure suggests that the asset is positioned for a possible move toward $2,200, with a breakout potentially extending the rally toward $2,400. The next major test will be whether ETH can convert the $2,000 resistance zone into long-term support.